Candle Strength Analyzer by The Ultimate Bull Run🎯 WHAT IT MEASURES
The score combines 4 key factors:
1️⃣ BODY RATIO (30%)
How much of the candle is "body" vs "wicks"
• 90%+ = Marubozu (very strong)
• 70%+ = Strong
• <30% = Weak/Indecision
2️⃣ CLOSE POSITION (25%)
Where the candle closed within its range
• Bullish closing near high = Strong
• Bearish closing near low = Strong
• Closing in middle = Weak
3️⃣ RELATIVE VOLUME - RVOL (25%)
Current volume compared to average
• RVOL 2.0+ = Very high activity
• RVOL 1.5+ = High (confirmed move)
• RVOL <0.7 = Low (unconfirmed)
4️⃣ SIZE vs ATR (20%)
Candle size compared to typical volatility
• 2x ATR = Large, significant
• 1x ATR = Normal
• 0.5x ATR = Small, insignificant
Candlestick analysis

ADP Heiken Ashi [Wonra]**Heiken Ashi candles dynamically colored by Accumulation/Distribution Pressure (ADP) zones for enhanced trend visualization**
---
## 📝 Full Description:
### ADP Heiken Ashi
This indicator combines **Heiken Ashi candles** with **Accumulation/Distribution Pressure (ADP)** analysis to provide enhanced trend visualization through dynamic candle coloring.
---
### 🔬 How It Works
**Accumulation/Distribution Pressure (ADP)** is a volume-weighted momentum oscillator that measures buying and selling pressure on a 0-100 scale:
- **ADP < 45**: Accumulation Zone (buying pressure dominant)
- **ADP > 55**: Distribution Zone (selling pressure dominant)
- **ADP 45-55**: Neutral Zone (balanced pressure)
**The Calculation:**
1. Price change is compared to True Range to determine directional strength
2. Volume is applied as a weight to amplify significant moves
3. RMA smoothing creates a stable 0-100 oscillator
4. A JMA (Jurik Moving Average) signal line provides trend context
**Heiken Ashi candles** are then colored based on the ADP zone:
- **Bright Green**: Bullish HA candle in Accumulation Zone with rising ADP
- **Bright Red**: Bearish HA candle in Distribution Zone with falling ADP
- **Orange**: Bullish HA in Distribution (potential exhaustion warning)
- **Blue**: Bearish HA in Accumulation (potential reversal brewing)
---
### 🎨 Visual Guide
| Candle Color | Meaning |
|--------------|---------|
| **Bright Green** | Strong bullish momentum + smart money accumulating |
| **Light Green** | Bullish but neutral zone - proceed with caution |
| **Bright Red** | Strong bearish momentum + distribution underway |
| **Light Red** | Bearish but neutral zone - watch for changes |
| **Orange** | Bullish price but distribution detected - warning |
| **Blue** | Bearish price but accumulation detected - reversal possible |
---
### ⚙️ Settings
**ADP Settings:**
- `ADP Period` (default: 14): Lookback period for pressure calculation
- `AD Weight`: Balance between pure AD ratio and signed weighting
- `Price Weighted Volume`: Apply price as additional volume weight
**JMA Signal Settings:**
- `JMA Length` (default: 21): Smoothing period for signal line
- `JMA Phase`: Overshoot control (-100 to +100)
- `JMA Power`: Smoothness factor (1-5)
**Zone Settings:**
- `Accumulation Zone`: ADP level below which accumulation is detected
- `Distribution Zone`: ADP level above which distribution is detected
---
### 📊 Info Panel
The top-right panel displays:
- Current ADP value with zone coloring
- JMA signal line value
- Current zone status (Accumulation/Distribution/Neutral)
- ADP momentum direction (Rising/Falling)
---
### 📈 Best Use Cases
- **Trend Confirmation**: Verify trend strength through zone analysis
- **Divergence Detection**: Price vs ADP zone divergence
- **Momentum Analysis**: Track accumulation/distribution phases
- **Context Overlay**: Use alongside other analysis tools
---
### ⚠️ Important Notes
- This is a **visualization tool**, not a trading signal generator
- Heiken Ashi candles smooth price action and may lag real prices
- Always combine with other analysis methods
- Past performance does not guarantee future results
---
### 🔄 Version History
**v1.1**
- Simplified to pure visualization tool
- Enhanced ADP zone coloring
- Added JMA signal line for context
- Streamlined info panel
---
**Created by Wonra | 2025**

EV Algo SMT 15m on 1mEV Algo SMT is a multi-timeframe SMT divergence indicator that compares price action between two correlated markets.
It uses higher timeframe pivots while plotting signals on a lower timeframe chart, helping identify potential bullish and bearish divergences with confirmation on candle close.

StockRadar - Gap Trading SystemStockRadar – Gap Trading System
StockRadar – Gap Trading System is a visual gap-detection and gap-trading helper for TradingView. It identifies significant price gaps, tracks how they evolve over time (unfilled, partially filled, fully closed, or time-limited), and simulates a structured gap-fill trade plan with configurable entry, stop-loss and take-profit logic. The goal is to help you spot high-quality gap opportunities faster and review historical performance directly on the chart.
What it does
Detects relevant gaps based on a minimum deviation threshold and plots them as clear, color-coded gap boxes.
Monitors each gap’s lifecycle and marks whether it stays open, gets partially filled, fully closed, or is closed by a time limit (optional).
Simulates a trade setup per gap using:
a configurable Trade Entry Trigger
a configurable Risk/Reward ratio
a configurable Take-Profit at Gap Close (%)
Visualizes the setup and outcome with entry/exit markers, SL/TP levels, and profit/loss labels.
Key features
Gap Visualization
Color-coded boxes for open / partial / fully closed / time-limited gaps
Optional remaining gap size (%) display
Adjustable border and fill transparency
Pre-entry vs active-trade shading inside the gap box for better readability
Trade Simulation & Chart Markings
Trade Entry Trigger:
Candle Close (more conservative)
Wick Touch (more aggressive)
Stop-Loss & Take-Profit lines drawn for all relevant gaps (not only the newest ones)
Optional “SL” / “TP” labels on the lines (menu toggle)
Entry vertical line inside the gap box to show where the trade became active
Trade result labels including profit/loss in % for completed trades
High-Probability Alerts (⚡)
Discrete ⚡ icon displayed inside the top-left corner of the gap box for high-probability setups (toggleable)
Uses historical performance context (win rate / break-even logic) to support more selective alerts
Dashboard (On-Chart Panel)
Clear PROFITABLE / NOT PROFITABLE / INSUFFICIENT DATA status based on win rate vs break-even and sample size
Shows key stats and (optional) trend speed analysis
“Data since” field to display the earliest evaluated gap date for transparency
Position Sizing Calculator (Optional)
Toggleable Position Sizing section
Input your available capital and risk % per trade
Calculates suggested share quantity (rounded down) for the latest high-probability setup
Displays entry price, position value, currency, and highlights when capital is insufficient
Who it’s for
This indicator is designed for traders who work with gap-fill behavior and want:
fast and consistent gap identification,
structured trade levels (entry/SL/TP),
clean historical review of outcomes,
and an at-a-glance dashboard summary without leaving the chart.
Notes / Disclaimer
This script is a charting and analysis tool, not financial advice. Always validate signals with your own risk management and market context. Past performance statistics are informational and do not guarantee future results.

Reference TimesThe Reference Times indicator highlights historical candles on your chart based on the user's selected criteria. This tool allows traders to reference the current graph's price movements against historical movements at specific times and days, helping to anticipate potential future market direction, swings, and timing.
For even more advaned features check out "Reference Times - Advanced"
good luck and all the best!

CVD Divergence Background By HKOverview This indicator visualizes Delta Divergences (also known as Absorption) directly on your main chart. It highlights candles where the price direction contradicts the underlying net volume flow (CVD). This is a powerful method to spot "traps," limit order absorption, and potential reversals.
How it Works The script calculates the Intrabar Volume Delta based on price action relative to the candle's range. It then compares this Delta with the candle's color (Open vs. Close).
Bearish Divergence (Absorption Top):
Scenario: The candle is GREEN (Price closed higher), but the Volume Delta is NEGATIVE (Net Selling).
Visual: Red Background.
Meaning: Sellers are aggressively absorbing the buying pressure via limit orders. Price struggled to rise despite the volume.
Bullish Divergence (Absorption Bottom):
Scenario: The candle is RED (Price closed lower), but the Volume Delta is POSITIVE (Net Buying).
Visual: Green Background.
Meaning: Buyers are aggressively absorbing the selling pressure via limit orders. Price struggled to fall despite the volume.
Features
Background Highlighting: Instantly spot divergences without checking a separate oscillator window.
Seamless Integration: Works perfectly behind your price candles and other indicators (like Big Trade detectors).
Customizable: You can adjust the colors and transparency to fit your chart theme.
Use Case Use this to identify exhausted moves. If you see a green candle with a red background at a resistance level, it suggests that buyers are running into a wall of sellers, increasing the probability of a reversal.

MTF Multi Indicator Table by JAB76TABLE for trading with EMA and ICHIMOKU , HELPS IN ANALYSIS OF TREND

A+ / A- Radar + BUY/SELL (VWAP & EMA9 & M2/T3)simple script with vwap and m9 and displacement create by m2/t3 code.
best timeframe to use 5m

TCR by AMAGADON TCR - THREE CANDLE RULES
The Methodology
TCR (Three Candle Rules) is a systematic confirmation indicator developed to solve the problem of "False Breakouts." Many traders lose capital by entering as soon as price touches a level; TCR eliminates this by enforcing a Two-Candle Validation rule.
The algorithm identifies a session-based range and requires price to "prove" its strength by holding outside that range for two consecutive candles before a signal is issued.
How the TCR Logic Works:
Zone Identification: The script anchors to the high and low of the session start (Asia, London, or NY).
Validation (The Rule):
For a BUY: Two consecutive M15 candles must both Open and Close entirely above the session high.
For a SELL: Two consecutive M15 candles must both Open and Close entirely below the session low.
The Trigger Box: Once validated, a Blue (Buy) or Red (Sell) box is drawn. The 50% (Midpoint) of the trigger candle becomes the high-probability entry zone.
STRICT FOREX RISK DISCLOSURE
⚠️ HIGH-RISK WARNING: Trading Foreign Exchange (Forex) involves a high level of risk and may not be suitable for all investors. The high degree of leverage can lead to the loss of your entire investment. Only trade with money you can afford to lose.
NO FINANCIAL ADVICE: TCR - THREE CANDLE RULES is a technical analysis tool for educational and informational purposes only. It does not constitute financial or investment advice.
LIMITATION OF LIABILITY:
No Accuracy Guarantees: Mathematical patterns do not guarantee future results.
Execution Risks: The author is not responsible for losses due to market volatility, news spikes, or broker slippage.
User Responsibility: By using this script, you acknowledge that all trading decisions are yours alone. The author is not liable for any financial damages

TSS by AMAGADONTSS - THE SESSION SETUP
The Methodology
THE SESSION SETUP (TSS) is a price-action framework that utilizes session-specific volatility to define intraday expansion zones. By isolating the opening ranges of the Asia, London, and New York sessions on the 15-minute (M15) timeframe, TSS identifies clear institutional "interest zones."
The algorithm monitors these ranges for two specific price-action events:
Primary Breakouts: Decisive candle closes outside the session boundaries.
Liquidity Reversals (Counter-Signals): Identification of "fake-outs" where price traps initial breakout traders before reversing through the entire session range.
Features
Automated Session Boxes: Dynamic range calculation for all major global sessions.
Precision TP Levels: Systematic profit targets based on the measured session range (R).
Timeframe Integrity: Built-in guard to ensure the logic is only applied to the M15 timeframe, preserving the accuracy of the range calculations.
Visual Median: Dotted mid-lines to identify the "mean" price within a session.
CRITICAL DISCLOSURE - PLEASE READ CAREFULLY
HIGH RISK INVESTMENT WARNING: Trading Foreign Exchange (Forex) is highly speculative, carries a high level of risk, and may not be suitable for all investors. You may sustain a loss of some or all of your invested capital; therefore, you should not speculate with capital that you cannot afford to lose. NO FINANCIAL ADVICE: The TSS - THE SESSION SETUP indicator is a technical analysis tool provided for informational and educational purposes only. It does not constitute investment advice, financial advice, or a recommendation to buy or sell any currency pair or financial instrument.
LIMITATION OF LIABILITY:
Execution Risk: The author does not guarantee the accuracy of signals. Market conditions, including news-driven volatility, spreads, and slippage, can result in trades that differ significantly from the indicator's visual signals.
Backtesting Limitation: Past performance and historical signals are not indicative of future results.
User Responsibility: You are solely responsible for your trading decisions. The author of this script shall not be held liable for any loss or damage, including without limitation, any loss of profit, which may arise directly or indirectly from the use of or reliance on this tool.
BY USING THIS SCRIPT, YOU AGREE THAT YOU ARE TRADING AT YOUR OWN RISK.

Koma-Indikator v2272,19
USD
+0,35
+0,13%
Apple, Inc. engages in the design, manufacture, and sale of smartphones, personal computers, tablets, wearables and accessories, and other varieties of related services. It operates through the following geographical segments: Americas, Europe, Greater China, Japan, and Rest of Asia Pacific. The Americas segment includes North and South America. The Europe segment consists of European countries, as well as India, the Middle East, and Africa. The Greater China segment comprises China, Hong Kong, and Taiwan. The Rest of Asia Pacific segment includes Australia and Asian countries. Its products and services include iPhone, Mac, iPad, AirPods, Apple TV, Apple Watch, Beats products, AppleCare, iCloud, digital content stores, streaming, and licensing services. The company was founded by Steven Paul Jobs, Ronald Gerald Wayne, and Stephen G. Wozniak in April 1976 and is headquartered in Cupertino, CA.
Es sind noch 14 Min. für die Script-Bearbeitung übrig
in dieser Minute
Koma-Indikator v2
Zu Favoriten hinzufügen
Auf Chart verwenden
0
0
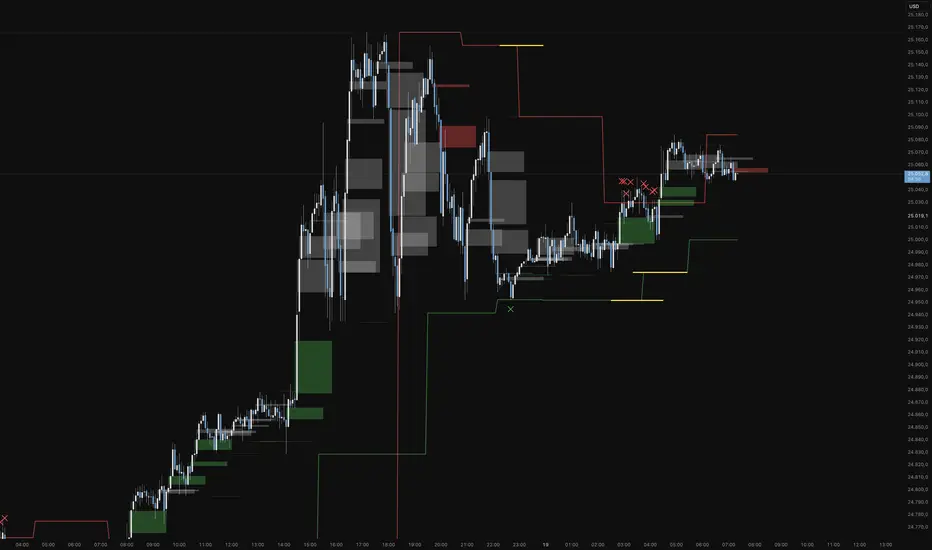
Functional Overview: Koma-Indikator V2
This indicator is a specialized analytical tool for Smart Money Concepts (SMC) trading. It is designed to automatically identify trend reversals, liquidity pools, and order flow shifts within the chart.
1. Liquidity Identification (BSL/SSL)
Major Range: The script automatically calculates significant highs and lows based on the "Major Lookback" period.
Buy-Side & Sell-Side Liquidity: These levels are plotted as red (BSL) and green (SSL) lines, serving as primary targets where the market often "hunts" for liquidity.
2. Sweep Detection (Liquidity Grabs)
The indicator detects when the price briefly exceeds a major high or low but closes back within the range.
Visuals: These potential reversal points are marked with an "X" icon above or below the candle (Sweep H/L).
3. Automated Market Structure Shifts (MSS)
The core logic tracks direction changes on two distinct levels:
Major MSS (Bold Yellow Line): Signals a significant trend reversal following a liquidity sweep. This is the primary confirmation for a new trend.
Minor MSS (Dotted Yellow Line): Highlights smaller structural breaks within a trend—ideal for aggressive "Sniper" entries on lower timeframes.
4. Dynamic Fair Value Gaps (FVG) & iFVGs
FVG Recognition: The indicator automatically draws boxes for bullish (green) and bearish (red) price imbalances.
Change in Delivery (iFVG): When a price candle closes through an existing FVG box, the box turns gray. This signals an Inverted FVG (iFVG), indicating that the order flow has officially shifted in the new direction.
5. Customization (Inputs)
Sensitivity: Users can adjust the lookback periods for both Trend (Major) and Entries (Minor) to suit different assets or timeframes.
Visual Hierarchy: All colors, line widths, and box lengths are configurable to maintain a clean and professional chart layout.
Trading Application:
By automating the "grunt work" of structural analysis, this tool allows you to focus on the trade execution:
Locate Liquidity: Identify BSL/SSL lines.
Watch for the Sweep: Look for the "X" marks.
Confirm the Shift: Wait for the yellow MSS lines.
Execute via Order Flow: Use the gray iFVG boxes as your Point of Interest (POI).
Geschütztes Skript
Dieses Script ist als Closed-Source veröffentlicht. Sie können es kostenlos und ohne Einschränkungen verwenden – erfahren Sie hier mehr.
Phantomas1
Haftungsausschluss
Die Informationen und Veröffentlichungen sind nicht als Finanz-, Anlage-, Handels- oder andere Arten von Ratschlägen oder Empfehlungen gedacht, die von TradingView bereitgestellt oder gebilligt werden, und stellen diese nicht dar. Lesen Sie mehr in den Nutzungsbedingungen.
Skript bearbeiten
Minimieren
Schließen
Koma-Indikator v2
Functional Overview: Koma-Indikator V2
This indicator is a specialized analytical tool for Smart Money Concepts (SMC) trading. It is designed to automatically identify trend reversals, liquidity pools, and order flow shifts within the chart.
1. Liquidity Identification (BSL/SSL)
Major Range: The script automatically calculates significant highs and lows based on the "Major Lookback" period.
Buy-Side & Sell-Side Liquidity: These levels are plotted as red (BSL) and green (SSL) lines, serving as primary targets where the market often "hunts" for liquidity.
2. Sweep Detection (Liquidity Grabs)
The indicator detects when the price briefly exceeds a major high or low but closes back within the range.
Visuals: These potential reversal points are marked with an "X" icon above or below the candle (Sweep H/L).
3. Automated Market Structure Shifts (MSS)
The core logic tracks direction changes on two distinct levels:
Major MSS (Bold Yellow Line): Signals a significant trend reversal following a liquidity sweep. This is the primary confirmation for a new trend.
Minor MSS (Dotted Yellow Line): Highlights smaller structural breaks within a trend—ideal for aggressive "Sniper" entries on lower timeframes.
4. Dynamic Fair Value Gaps (FVG) & iFVGs
FVG Recognition: The indicator automatically draws boxes for bullish (green) and bearish (red) price imbalances.
Change in Delivery (iFVG): When a price candle closes through an existing FVG box, the box turns gray. This signals an Inverted FVG (iFVG), indicating that the order flow has officially shifted in the new direction.
5. Customization (Inputs)
Sensitivity: Users can adjust the lookback periods for both Trend (Major) and Entries (Minor) to suit different assets or timeframes.
Visual Hierarchy: All colors, line widths, and box lengths are configurable to maintain a clean and professional chart layout.
Trading Application:
By automating the "grunt work" of structural analysis, this tool allows you to focus on the trade execution:
Locate Liquidity: Identify BSL/SSL lines.
Watch for the Sweep: Look for the "X" marks.
Confirm the Shift: Wait for the yellow MSS lines.
Execute via Order Flow: Use the gray iFVG boxes as your Point of Interest (POI).
Fortfahren
SB Scanner (V2)⸻
📊 Stacey Burke Signal Day Scanner
This script is a multi-instrument signal day scanner scanner inspired by concepts taught by Stacey Burke. It is designed to help traders quickly identify contextual price behaviors across multiple futures, crypto, or index markets from a single chart.
The scanner evaluates a customizable list of symbols and displays results in a clean, configurable table on the chart.
⸻
🔍 What the Scanner Detects
For each symbol, the script analyzes signal days and highlights:
• FRD / FGD
First Red Days and First Green Days based on multi-day price behavior.
• 3-Day Breakout Sequences (3DL / 3DS)
Identifies consecutive directional expansion over three sessions.
• Inside / Outside Days (ID / OD)
Detects compression and expansion patterns in daily ranges.
• CIB (Close-In-Breakout)
Flags closes near the prior day’s range extremes.
• 3-Day Cycle Continuation
Highlights potential Day-3 directional continuation scenarios.
All pattern columns can be individually toggled on or off to keep the table focused on what matters most to you.
⸻
🧭 How It’s Meant to Be Used
This scanner is not a trade signal generator. It is a context and awareness tool intended to:
Help traders monitor multiple markets simultaneously
Quickly spot structural conditions worth deeper analysis
Support discretionary decision-making within a broader trading plan
It works best when combined with session context, key levels, and execution logic chosen by the trader.
⸻
🎨 Customization & Display
Adjustable table position (top/bottom, left/center/right)
Custom colors for:
Background
Text
Current chart symbol
Supports up to 24 symbols
Designed to be visually clean and easy on the eyes
⸻
⚠️ Disclaimer
This script is provided for educational and informational purposes only.
It does not constitute financial advice, investment recommendations, or trade signals.
All trading decisions and risk management remain the responsibility of the user.
⸻

Candle Strength Analyzer by The Ultimate Bull Run# Candle Strength Analyzer
## 📊 Complete Beginner's Guide
---
### 🎯 What This Indicator Does
The **Candle Strength Analyzer** measures how "strong" or "weak" each candlestick is and displays a **score from 0 to 100** above or below every candle.
- **Green numbers** = Bullish (price went UP)
- **Red numbers** = Bearish (price went DOWN)
- **Gray numbers** = Doji (price barely moved)
**Higher score = Stronger candle = More reliable signal**
---
### 🕯️ Understanding Candlesticks (The Basics)
If you're new to trading, here's what a candlestick shows:
```
│ ← Upper Wick (prices that were rejected)
│
┌───┐
│ │ ← Body (the "real" price movement)
│ │ • Green/White body = Price went UP (Bullish)
│ │ • Red/Black body = Price went DOWN (Bearish)
└───┘
│
│ ← Lower Wick (prices that were rejected)
```
**Key Terms:**
- **Open**: The price when the candle started
- **Close**: The price when the candle ended
- **High**: The highest price during the candle
- **Low**: The lowest price during the candle
- **Body**: The rectangle between Open and Close
- **Wick/Shadow**: The thin lines above and below the body
---
## 📐 The 4 Components of Candle Strength
This indicator combines **4 measurements** to calculate the final strength score. Let's understand each one:
---
### 1️⃣ Body Ratio (30% of score)
**What it is:**
The percentage of the candle that is "body" versus "wicks."
**Formula:**
```
Body Ratio = Size of Body ÷ Total Candle Size × 100
```
**What it tells you:**
- **High Body Ratio (70-100%)**: Bulls or bears were in FULL control. The price moved in one direction and STAYED there. This is strong.
- **Low Body Ratio (0-30%)**: There was a fight. Price moved up AND down but ended up roughly where it started. This is weak/indecisive.
**Visual Example:**
```
Strong Candle (90% body): Weak Candle (20% body):
│ │
┌───┐ │
│ │ ┌─┴─┐
│ │ ← Mostly body │ │ ← Tiny body
│ │ └─┬─┘
└───┘ │
│ │
```
**How to interpret:**
| Body Ratio | Meaning |
|------------|---------|
| 90-100% | **Marubozu** - Extremely strong, full commitment |
| 70-90% | **Strong** - Clear winner (bulls or bears) |
| 40-70% | **Normal** - Typical market activity |
| 10-40% | **Weak** - Significant indecision |
| 0-10% | **Doji** - Complete indecision, no winner |
---
### 2️⃣ Close Position Score (25% of score)
**What it is:**
WHERE the candle closed within its range (high to low).
**What it tells you:**
- For a **bullish (green) candle**: Closing near the HIGH means buyers were still eager at the end = STRONG
- For a **bearish (red) candle**: Closing near the LOW means sellers were still eager at the end = STRONG
**Visual Example:**
```
Strong Bullish: Weak Bullish:
(closes near high) (closes near middle)
┌───┐ ← Close here │
│ │ ┌─┴─┐ ← Close here
│ │ │ │
│ │ │ │
└───┘ └───┘
│ │
```
**Why it matters:**
If price went UP but then sellers pushed it back down before the candle closed, that's a sign of weakness. The bulls couldn't hold their ground.
**How to interpret:**
| Close Position | For Bullish Candle | For Bearish Candle |
|----------------|-------------------|-------------------|
| 80-100% | Strong (near high) | Weak (near high) |
| 50-80% | Moderate | Moderate |
| 20-50% | Weak | Moderate |
| 0-20% | Very Weak (near low) | Strong (near low) |
---
### 3️⃣ Relative Volume - RVOL (25% of score)
**What is Volume?**
Volume is the NUMBER of shares/contracts traded during that candle. Think of it as "how many people participated."
**What is RVOL?**
RVOL compares TODAY'S volume to the AVERAGE volume.
**Formula:**
```
RVOL = Current Volume ÷ Average Volume (last 20 candles)
```
**What it tells you:**
- **RVOL = 1.0**: Normal activity (same as average)
- **RVOL = 2.0**: DOUBLE the normal activity (2x more traders involved)
- **RVOL = 0.5**: HALF the normal activity (fewer traders involved)
**Why it matters:**
A big price move with LOW volume is suspicious - it might not last.
A big price move with HIGH volume is confirmed - many traders agree.
**Think of it like voting:**
- High volume = Many people voted for this direction
- Low volume = Only a few people voted, decision might change
**How to interpret:**
| RVOL | Meaning | Signal Quality |
|------|---------|----------------|
| 2.0+ | Very High - Institutional activity likely | ⭐⭐⭐ Excellent |
| 1.5-2.0 | High - Significant interest | ⭐⭐ Good |
| 1.0-1.5 | Above Average | ⭐ Acceptable |
| 0.7-1.0 | Below Average | ⚠️ Caution |
| < 0.7 | Low - Lack of interest | ❌ Unreliable |
---
### 4️⃣ Size vs ATR (20% of score)
**What is ATR?**
ATR stands for "Average True Range." It measures how much the price TYPICALLY moves.
**What this component measures:**
How big is THIS candle compared to how big candles USUALLY are?
**Formula:**
```
ATR Ratio = This Candle's Size ÷ Average Candle Size (ATR)
```
**What it tells you:**
- **ATR Ratio = 2.0**: This candle is TWICE as big as normal = Significant move
- **ATR Ratio = 1.0**: This candle is normal sized
- **ATR Ratio = 0.5**: This candle is HALF the normal size = Minor move
**Why it matters:**
A 50-point move in a stock that normally moves 100 points is small.
A 50-point move in a stock that normally moves 20 points is HUGE.
Context matters!
**How to interpret:**
| ATR Ratio | Meaning |
|-----------|---------|
| 2.0+ | **Expansion** - Unusually large move, potential breakout |
| 1.5-2.0 | **Large** - Significant momentum |
| 1.0-1.5 | **Above Average** - Notable move |
| 0.5-1.0 | **Normal** - Typical movement |
| < 0.5 | **Small** - Insignificant, might be noise |
---
## 🧮 How the Final Score is Calculated
The indicator combines all 4 components with these weights:
```
Final Score = (Body Ratio × 30%) +
(Close Position × 25%) +
(RVOL Score × 25%) +
(Size Score × 20%)
```
**Result: A score from 0 to 100**
---
## 📊 Understanding the Strength Score
| Score | Classification | What It Means | Should You Trade It? |
|-------|---------------|---------------|---------------------|
| **70-100** | 🟢 STRONG | High conviction move, reliable signal | ✅ Yes - Good setup |
| **40-70** | 🟡 MODERATE | Average move, needs confirmation | ⚠️ Maybe - Add other indicators |
| **0-40** | 🔴 WEAK | Low conviction, unreliable | ❌ No - Wait for better setup |
---
## 🏷️ Special Pattern Markers
The indicator also detects special candlestick patterns:
### ⚡ Power Candle
**Requirements:**
- Body Ratio > 70% (strong body)
- RVOL > 1.5 (high volume)
- Close Position > 80% (closes near the extreme)
**What it means:** The BEST possible signal. Everything aligns perfectly.
### Ⓜ️ Marubozu
**Requirements:**
- Body Ratio > 90% (almost no wicks)
**What it means:** Complete dominance by bulls or bears. Very strong continuation signal.
### ◆ High Volume Doji
**Requirements:**
- Doji candle (tiny body)
- High volume
**What it means:** Many traders are fighting, but no one won. Often signals a REVERSAL is coming.
---
## ⚙️ Settings Explained
### Volume Settings
| Setting | Default | What It Does |
|---------|---------|--------------|
| Volume Lookback Period | 20 | How many candles to average for "normal" volume |
| RVOL Threshold | 1.5 | What counts as "high" volume (1.5 = 50% above average) |
### ATR Settings
| Setting | Default | What It Does |
|---------|---------|--------------|
| ATR Period | 14 | How many candles to calculate average movement |
| ATR Multiplier | 1.5 | What counts as a "large" candle |
### Strength Thresholds
| Setting | Default | What It Does |
|---------|---------|--------------|
| Strong Candle Threshold | 70 | Score needed to be "strong" |
| Weak Candle Threshold | 30 | Score below this is "weak" |
### Label Filter (Important!)
TradingView limits indicators to **500 labels maximum**. Use filters to see more history:
| Filter Mode | Shows | Best For |
|-------------|-------|----------|
| All Candles | Every single candle | Short-term charts (5min, 15min) |
| Strong Only (70+) | Only strong candles | Longer history, key signals only |
| Moderate+ (40+) | Moderate and strong | Balance of detail and history |
| Custom Minimum | Your choice | Full control |
**Tip:** On daily charts, use "Strong Only" to see months of history instead of just a few weeks.
### Label Settings
| Setting | What It Does |
|---------|--------------|
| Label Size | tiny / small / normal / large |
| Show Decimal Places | Show "72.5" instead of "73" |
| Label Style | With background bubble OR just text |
---
## 📖 How to Read the Info Table
The table in the corner shows details for the CURRENT (most recent) candle:
| Row | Meaning |
|-----|---------|
| **Candle Strength** | The final score (0-100) |
| **Direction** | BULLISH / BEARISH / DOJI |
| **Body Ratio** | Percentage of candle that is body |
| **Close Position** | Where it closed (0-100) |
| **Upper Wick** | Size of upper wick as % |
| **Lower Wick** | Size of lower wick as % |
| **RVOL** | Current volume vs average (1.5x = 50% above average) |
| **Size/ATR** | Candle size vs average size |
| **Classification** | STRONG / MODERATE / WEAK |
| **Vol Confirmed** | Is volume above threshold? |
| **Pattern** | Special pattern detected |
---
## 🎓 How to Use This Indicator
### Step 1: Add to Chart
1. Open Pine Editor in TradingView
2. Paste the code
3. Click "Add to Chart"
### Step 2: Adjust Filter (if needed)
- If you see "max labels reached," change filter to "Strong Only (70+)"
- This lets you see more candles in history
### Step 3: Look for Strong Signals
Focus on candles with:
- ✅ Score **70+** (bright green or red)
- ✅ **RVOL > 1.5** (confirmed by volume)
- ✅ Special markers (⚡, M, ◆)
### Step 4: Avoid Weak Signals
Be careful with candles that have:
- ❌ Score **below 40** (muted colors)
- ❌ **RVOL < 1.0** (no volume confirmation)
- ❌ Large wicks (rejection happened)
---
## 💡 Trading Tips for Beginners
### ✅ DO:
1. **Wait for strong candles (70+)** before entering trades
2. **Confirm with volume** - Look for RVOL > 1.5
3. **Use at support/resistance levels** - Strong candles at key levels are more meaningful
4. **Combine with other indicators** - RSI, MACD, or moving averages
5. **Practice on demo first** - Learn to recognize strong vs weak candles
### ❌ DON'T:
1. **Trade every candle** - Not all candles are worth trading
2. **Ignore volume** - A strong candle with low volume is suspicious
3. **Fight the trend** - Strong bearish candles in an uptrend might just be pullbacks
4. **Over-leverage** - Even strong signals can fail
---
## 📝 Quick Reference Cheat Sheet
```
STRONG CANDLE CHECKLIST:
□ Score 70+
□ RVOL > 1.5
□ Body Ratio > 60%
□ Close Position > 75% (bullish) or < 25% (bearish)
□ At key support/resistance level
WEAK CANDLE WARNING SIGNS:
□ Score < 40
□ RVOL < 0.7
□ Large wicks (> 30%)
□ Doji pattern
□ Small candle (ATR Ratio < 0.5)
```
---
## ⚠️ Important Disclaimers
1. **No indicator is 100% accurate** - Always use stop losses
2. **Past performance ≠ future results** - Markets change
3. **This is a tool, not a strategy** - Combine with other analysis
4. **Practice first** - Use paper trading before real money
---
## 🔔 Alerts Available
Set alerts for:
- Strong Bullish Candle (with volume confirmation)
- Strong Bearish Candle (with volume confirmation)
- Power Candle detected
- Marubozu detected
- High Volume Doji detected
---
## ❓ FAQ
**Q: Why are some candles missing labels?**
A: TradingView limits indicators to 500 labels. Use filters to see more history.
**Q: The label colors are hard to see. Can I change them?**
A: Yes! Go to Settings → Colors and customize all colors.
**Q: Should I only trade strong candles?**
A: Strong candles are MORE reliable, but not guaranteed. Always use proper risk management.
**Q: What timeframe works best?**
A: Works on all timeframes. Higher timeframes (4H, Daily) tend to have more reliable signals.
**Q: Can I use this for crypto/forex/stocks?**
A: Yes! This indicator works on any market with candlestick data and volume.
---
## 📚 Glossary
| Term | Definition |
|------|------------|
| **Bullish** | Price is going UP / Buyers are winning |
| **Bearish** | Price is going DOWN / Sellers are winning |
| **Doji** | Candle where open and close are nearly equal (indecision) |
| **Marubozu** | Candle with no wicks (full body) |
| **RVOL** | Relative Volume - current volume vs average |
| **ATR** | Average True Range - typical price movement |
| **Wick/Shadow** | The thin lines above/below the candle body |
| **Support** | Price level where buyers tend to step in |
| **Resistance** | Price level where sellers tend to step in |
| **Breakout** | When price moves beyond support/resistance |
---
**Happy Trading! 📈**
*Remember: The best traders are patient traders. Wait for strong setups.*

Entry / TP / SL Alert Bands (Simple & Stable)Entry / TP / SL Alert Bands – Invite-Only Version
Description
This tool plots customizable Entry, Take-Profit, and Stop-Loss reference levels, along with two alert bands derived as a percentage of the distance between Entry→TP and Entry→SL. The bands update immediately when inputs are adjusted and remain constant across the chart. This is useful for traders who want to visually monitor when price approaches key zones associated with their pre-defined trade plan.
Core Features
• Manual Entry, TP, and SL input fields
• Long or Short mode
• Upper alert band = a user-defined % of the distance toward TP
• Lower alert band = a user-defined % of the distance toward SL
• Optional visibility controls for Entry, TP, SL lines
• Alerts for:
– Price crossing the upper band
– Price crossing the lower band
– Price crossing either band
• Works on any symbol and any timeframe
• Alerts use TradingView’s built-in alertcondition() system
How It Works
The script computes the absolute distance between Entry→TP and Entry→SL, then applies user-defined percentages to determine where the alert bands should be drawn. If TP/SL are reversed relative to Entry for the selected direction, the relevant band may be invisible (e.g., negative or invalid distance). Proper TP/SL placement is required for intended use.
Notes
• This tool does not generate buy/sell signals.
• This tool does not provide financial advice.
• Proper risk management, independent decision-making, and verification of all settings are required.
⸻

Asia/London/NY Session Slope LinesTITLE: Asia/London/NY Session Slope Lines
Track momentum across all three major trading sessions with automated slope lines showing pips per bar movement.
📊 VISUALIZE SESSION MOMENTUM AT A GLANCE
This powerful indicator automatically draws slope lines for all three major forex trading sessions (Asia, London, and New York), giving you instant insight into directional bias and momentum for each session.
✨ KEY FEATURES:
• Three Session Coverage - Asia, London, and New York sessions tracked simultaneously
• Pips Per Bar Calculation - See exact momentum as "pips moved per bar" for easy comparison
• Customizable Styling - Different colors, line styles, and widths for each session
• Auto-Detection - Automatically identifies session boundaries and draws lines
• Clean Labels - Each session displays its slope value directly on the chart
• Session Markers - Optional triangles show exact start/end of each session
📈 HOW IT WORKS:
The indicator calculates the slope by measuring:
1. Price movement during the entire session (in pips)
2. Number of bars in that session
3. Result: Pips per bar (momentum strength)
Example: If Asia session moved +30 pips over 60 bars = +0.50 pips/bar slope
🎨 VISUAL CLARITY:
• Asia Session: Solid lines (Green/Red by default)
• London Session: Dashed lines (Blue/Orange by default)
• New York Session: Dotted lines (Lime/Fuchsia by default)
• Positive slopes = Bullish momentum
• Negative slopes = Bearish momentum
🔧 FULLY CUSTOMIZABLE:
• Adjust session times for any timezone
• Change colors for positive/negative slopes per session
• Toggle session boundary markers on/off
• Modify line width and style independently
💡 PERFECT FOR:
✓ Session traders who focus on specific market hours
✓ Identifying which session has the strongest momentum
✓ Spotting trend continuation or reversal between sessions
✓ Comparing volatility across different trading sessions
✓ Finding the best session for your trading strategy
⚙️ WORKS WITH:
• All forex pairs (EUR/USD, GBP/USD, USD/JPY, etc.)
• Any timeframe (works best on 5m-1H charts)
• Automatically adjusts pip calculation for JPY pairs
🚀 QUICK SETUP:
1. Add indicator to chart
2. Customize session times if needed (Settings → Input tab)
3. Adjust colors and styles (Settings → Style tab)
4. Start trading with clear session momentum insight!
No complex configuration needed - works perfectly with default settings!
🚀 QUICK START GUIDE - Asia/London/NY Session Slope Lines
──────────────────────────────────────────────────────────────
STEP 1: ADD TO CHART
──────────────────────────────────────────────────────────────
1. Open TradingView
2. Select any forex pair (e.g., EUR/USD)
3. Click "Indicators" at top of chart
4. Search: "Asia/London/NY Session Slope Lines"
5. Click to add to chart
──────────────────────────────────────────────────────────────
STEP 2: UNDERSTAND WHAT YOU SEE
──────────────────────────────────────────────────────────────
You'll see THREE different slope lines per day:
📍 ASIA SESSION (Solid Line)
• Default: 00:00 - 09:00 (Exchange time)
• Green = Bullish | Red = Bearish
• Label shows: "Asia +0.85 pips/bar"
📍 LONDON SESSION (Dashed Line)
• Default: 03:00 - 12:00 (Exchange time)
• Blue = Bullish | Orange = Bearish
• Label shows: "London -1.23 pips/bar"
📍 NEW YORK SESSION (Dotted Line)
• Default: 09:30 - 16:00 (Exchange time)
• Lime = Bullish | Fuchsia = Bearish
• Label shows: "NY +2.14 pips/bar"
──────────────────────────────────────────────────────────────
STEP 3: HOW TO READ THE SLOPES
──────────────────────────────────────────────────────────────
The number tells you MOMENTUM STRENGTH:
+0.10 to +0.50 pips/bar = Weak uptrend
+0.50 to +1.50 pips/bar = Moderate uptrend
+1.50+ pips/bar = Strong uptrend
-0.10 to -0.50 pips/bar = Weak downtrend
-0.50 to -1.50 pips/bar = Moderate downtrend
-1.50+ pips/bar = Strong downtrend
──────────────────────────────────────────────────────────────
STEP 4: TRADING STRATEGIES
──────────────────────────────────────────────────────────────
✅ CONTINUATION PLAY:
If Asia = +1.2 pips/bar AND London = +0.8 pips/bar
→ Look for LONG entries during NY session
✅ REVERSAL PLAY:
If Asia = +2.5 pips/bar (strong) AND London = -0.3 pips/bar
→ Momentum shifted, watch for reversal
✅ STRONGEST SESSION:
Compare all three slopes - trade during the session with highest absolute value
NY = +3.2 pips/bar > London = +1.1 > Asia = +0.4
→ NY session has strongest momentum
──────────────────────────────────────────────────────────────
STEP 5: CUSTOMIZE (OPTIONAL)
──────────────────────────────────────────────────────────────
Click the gear icon ⚙️ next to indicator name:
🕐 ADJUST SESSION TIMES:
Settings → Asia Session → Change hours
(Use YOUR timezone or exchange timezone)
🎨 CHANGE COLORS:
Settings → Asia/London/NY Style → Pick colors
👁️ HIDE MARKERS:
Settings → Display Options → Uncheck "Show Session Markers"
──────────────────────────────────────────────────────────────
STEP 6: BEST PRACTICES
──────────────────────────────────────────────────────────────
📊 Use on 5-minute to 1-hour charts
(Too high timeframe = not enough bars per session)
💱 Works best on major forex pairs
(EUR/USD, GBP/USD, USD/JPY, etc.)
🕐 Verify session times match your trading timezone
(Default is exchange timezone)
📈 Combine with support/resistance levels
(Strong slope + key level = high probability setup)

CE-PE-S/RThis Indicator Purely we design for option traders to do in intraday, here you can view both CE & PE Support & Resistance.
You have to chose same strike CE & PE
Yellow Line will give as a pivot Point
Red Line are we consider as a Target or Resistance
Green Line are we Consider as a Sellers Target or Support Line.
Above Yellow we consider Strong Up.

Universal Po3 Profiler [Pro +] | cephxsUNIVERSAL Po3 PROFILER 🧪
All concepts used in the development of this indicator are open source and available to all on youtube.
Credits go out to Michael J. H. (ICT) as the one putting it out there for all.
A refined approach to multi-timeframe structural analysis. Clean visuals. Precise signals. Nothing more than what matters.
OVERVIEW
Built for traders who value clarity over complexity, this profiler distills institutional price delivery concepts into a visually cohesive overlay. It maps higher timeframe structure directly onto your chart while detecting key divergence patterns across correlated assets.
The design philosophy is intentional minimalism—every element earns its place on your chart. No redundant indicators. No visual noise. Just the structural context you need to frame your trading decisions.
📷 Full indicator overview showing HTF candles, CISD lines, and SMT divergences on a 5m YM chart
CORE FEATURES
🧪 Multi-Timeframe Profiling
Automatically profiles up to three higher timeframes based on your chart's resolution. The system intelligently selects appropriate HTF pairings—or lets you override with manual control. 0 stress, minimal input overload.
Auto Mode: Adapts HTF selection to your chart timeframe
Profiler Source: Choose which HTF defines your structural boundaries
Directional Bias: Filter profiling to bullish or bearish setups only
📷 Side-by-side comparison; Auto mode on 5m chart vs 15m chart showing different HTF selections
🔀 SMT DIVERGENCE DETECTION
Identifies Smart Money divergences between correlated assets in real-time. When the primary asset makes a structural move that correlated pairs fail to confirm by moving in-sync, the system flags potential reversals.
Tracks divergences across multiple HTF sessions
Supports both normal and inverse correlations
Independent chart and HTF candle visualization
Automatic invalidation when divergence resolves
Configurable asset pairs with correlation library integration that is updated regularly
📷 SMT divergence example, ES vs YM showing bearish divergence at session highs
📐 CISD DETECTION & FIBONACCI PROJECTIONS
Change in State of Delivery (CISD) marks the moment price starts to deliver in the opposing direction of where it previously went. The system identifies these pivotal transitions and projects optional Fibonacci extensions to map potential price targets.
Automatic stretch calculation from opposing candle sequences
Confirmation-based detection (not predictive)
Fibonacci projections with customizable levels (-1 to -4.5)
Size filtering to eliminate noise on smaller moves
Visual invalidation when structure breaks
📷 Confirmed CISD with Fibonacci projection levels (other features disabled to highlight)
📷 Multiple CISDs showing bullish and bearish examples simultaneously
🎯 MANIPULATION AREA PROFILING
Detects sweep-and-reversal sequences within HTF candle boundaries. The profiling system identifies when price sweeps the immediate previous candle's extreme then confirms directional commitment after a candle close.
How the manipulation area is calculated (it is not a magic level, it's a simple division : ) )
For C3 : is measured from the Open of C3 to the quadrant C.E of C2
For C4 : is measured from the Open of C4 to the Upper Quadrant (25/75) of C3.
All Based on openly-sourced ICT Concepts
Po3 area visualization on profiler HTF
Sweep line tracking at structural levels
C1/C2/C3 phase progression
Bias filtering for directional focus
📷 Manipulation area highlighting Po3 zone with sweep lines
HTF CANDLE VISUALIZATION
Projects higher timeframe candles to the right of your chart, providing structural context without cluttering price action. Full credit for the base logic used in building this goes to @fadizeidan.
Up to 3 HTF layers with independent candle counts
PSP (Precision Swing Point) divergence detection on candles
Clean, adjustable styling
Session labels with countdown timers
INPUTS
Directional Bias
Po3 Profiling Bias: Auto / Bullish / Bearish — filters manipulation area detection
CISD/SSMT Bias: Auto / Bullish / Bearish — filters divergence detection
HTF Configuration
Auto Mode: Enabled by default. Automatically configures HTF timeframes
HTF 1/2/3: Manual timeframe selection when Auto Mode disabled
Profiler Source: Which HTF defines profiling boundaries
SMT Settings
Enable SMT: Master toggle for divergence detection
Show on Chart: Render divergence lines on price chart
Show on HTF Candles: Render divergence lines on HTF candle visuals
Asset Selection: Configure correlated pairs and inversion settings
CISD Settings
Show CISD: Enable change in state detection
Fibonacci Projections: Enable extension level plotting
Level Configuration: Toggle individual fib levels (-1 through -4.5)
Profiler Status Bar
Position: 9 positions including center options
Styling: Size, bold toggle, custom colors
---
RECOMMENDED USAGE
Start with Auto Mode enabled to learn the HTF relationships
Set your directional bias if you have a higher timeframe thesis
Watch for SMT divergences at session extremes
Use CISD confirmations to identify structural shifts
Reference Fibonacci projections for potential targets
Optimal Timeframes:
Scalping: 1m-3m charts (profiles to 15m-90m)
Intraday: 5m-15m charts (profiles to 1H-4H / Optionally 6H)
Swing: 1H-4H charts (profiles to Daily-Weekly)
---
CORRELATED ASSETS
The SMT system works with major correlations including:
Index Futures: CME_MINI:ES1! , CME_MINI:NQ1! , CBOT_MINI:YM1!
Forex Majors: FOREXCOM:EURUSD , FOREXCOM:GBPUSD , TVC:DXY
Crypto: BINANCE:BTCUSDT , BINANCE:ETHUSDT
Crypto Futures: CME:BTC1! , CME:ETH1!
---
NOTES
This version does not include alert conditions. Visual-first design.
It will be easier to understand if you have a preliminary knowledge of the concepts beforehand
This is not a learning instrument on it's own and could have bugs, Know it for yourself so you can identify bugs if any.
---
DISCLAIMER
This indicator is provided for educational and analytical purposes only. It does not constitute financial advice, and no representation is made regarding future performance.
Trading involves substantial risk of loss. Always conduct your own analysis and use proper risk management. Past structural patterns do not guarantee future price behavior.
---
CREDITS
Inspiration and HTF candle plotting boilerplate: @fadizeidan
Asset correlation library: fstarcapital
Development: cephxs & fstarcapital
---
CHANGELOG
v1.0: Initial Pro+ release — SMT divergences, CISD detection, multi-HTF Po3 profiling


Strat Structure Engine 3-F2 Tiered Strat Structure Engine – 3→F2 Tiered Dashboard
Overview
The Strat Structure Engine – 3→F2 Tiered Dashboard is a structure-focused indicator built on The Strat methodology, designed to identify, score, and tier high-quality 3 → Failed 2 (3→F2) structural failures in real time.
Rather than treating all Failed 2s equally, this script evaluates structure strength, volatility, volume participation, and candle quality, producing a tiered signal system that helps traders prioritize only the most meaningful setups.
This indicator is intended for traders who want objective structure validation, not subjective pattern guessing.
Core Concepts
This script focuses on three-bar structure transitions, specifically:
3 → Failed 2 (3→F2)
Supporting context via 3→1 and 1→3 structural sequences
Optional Inside Bar detection for compression awareness
The primary edge comes from grading the quality of the 3→F2, not merely detecting it.
3→F2 Tiered Scoring System
When a confirmed 3-bar is followed by a strict Failed 2, the script assigns a numeric score (0–8) based on four objective components:
1. Three-Bar Structure Quality
Measured using ATR-based range expansion:
Large expansion relative to ATR receives higher scores
Ensures the setup originates from meaningful volatility, not noise
2. Failed 2 Close Quality
Evaluates where price closes relative to the midpoint of the prior 3-bar:
Strong closes through the midpoint score higher
Weak or indecisive closes are downgraded
3. Body Dominance
Measures the body-to-range ratio of the Failed 2 candle:
Large, decisive bodies indicate real participation
Wicks and indecision reduce the score
4. Relative Volume Confirmation
Compares current volume against a moving average baseline:
Elevated volume confirms acceptance
Low volume reduces conviction
Tier Classification
Based on the total score, each valid 3→F2 is classified into a tier:
A+ Tier → Exceptional structure, volatility, and participation
A Tier → High-quality, trade-worthy setup
B Tier → Valid but lower-confidence structure
Below Threshold → Ignored (filtered out)
Only setups meeting a minimum quality threshold are labeled, helping reduce chart clutter and overtrading.
Visual & Dashboard Features
Clear directional labels plotted above or below bars
Tier designation and score display (e.g., 6/8)
Configurable toggles for:
Failed 2 labels
3→1 and 1→3 sequence labels
Inside Bar labels
3→F2 tier labels
Designed to work cleanly across all timeframes and instruments
Intended Use
This indicator is best used as:
A structure qualification layer, not a standalone entry trigger
A tool to rank setups, not force trades
Confirmation alongside:
Key levels (VWAP, Value Area, prior highs/lows)
Order flow or delta tools
Session context (RTH, Globex, IB)
What This Indicator Is Not
Not a prediction tool
Not a signal that guarantees outcome
Not a replacement for risk management
It objectively answers one question only:
“Is this 3→Failed 2 structurally strong enough to matter?”

OW_MTF CandleDescription
Overview The OW_MTF+ indicator allows traders to visualize Higher Timeframe (HTF) candlesticks directly on their current chart. Designed for Price Action and Smart Money Concepts (SMC) traders, this tool helps you perform Top-Down Analysis without switching back and forth between timeframes.
Unlike standard MTF indicators, this script features a Dynamic History Fade system that automatically adjusts the transparency of older candles, keeping your chart clean and focused on recent price action.
Key Features
・Multi-Timeframe Overlay: Display candles from any higher timeframe (e.g., show 4-Hour candles on a 15-Minute chart).
・Real-Time Updates: Uses lookahead=barmerge.lookahead_on to ensure the forming HTF candle updates in real-time with the current market price, allowing for immediate reaction to live price action.
・Dynamic Transparency (Fade Effect): The indicator includes a smart visual management system. It automatically increases the transparency of older historical candles so they do not obscure your chart, while keeping the most recent candles vivid and clear.
・Extended History: Supports displaying up to 500 historical HTF bars, giving you a deep view of past market structure.
・Time-Accurate Positioning: utilizes xloc.bar_time to ensure candles and wicks are perfectly aligned with the correct timestamp, preventing visual misalignment during market gaps.
Settings & Customization
・Timeframe: Select your desired Higher Timeframe (e.g., 240 for 4-Hour, D for Daily).
・History Depth: Choose how many HTF bars to display (Max 500).
Visual Styles: Fully customizable colors for Bullish/Bearish bodies, wicks, and borders.
・Auto Extend Mode: When enabled, this optimizes the transparency of the most recent 50 bars for the best visual experience.
Technical Note This indicator uses lookahead_on to retrieve HTF data. This is intentional to allow the current forming bar to update in real-time. Please note that while the historical closed candles are permanent, the currently active HTF candle will update tick-by-tick until it closes.
概要
OW_MTF Candleは、現在表示しているチャート上に上位足のローソク足を重ねて表示するマルチタイムフレーム・インジケーターです。 プライスアクションやスマートマネーコンセプト(SMC)を用いたトレードにおいて、時間足を切り替えることなくトップダウン分析を行うのに最適です。
通常のMTFインジケーターとは異なり、**「ダイナミック・ヒストリー・フェード(動的透明度調整)」**機能を搭載しています。これにより、過去の古いローソク足の透明度を自動的に上げ、最新のプライスアクションを強調しつつ、チャート全体の視認性を保ちます 。
主な機能
・マルチタイムフレーム表示: 任意の上位足を選択して表示可能です(例:15分足チャートに4時間足のローソクを表示など)。
・リアルタイム更新: request.security で lookahead=barmerge.lookahead_on を使用しているため、現在形成中の上位足もリアルタイムの価格に追従して動きます 。
・動的透明度(フェード効果): 過去の履歴バーがチャートを邪魔しないよう、古い足ほど自動的に透明度を高く調整します。これにより最新の相場状況がクリアに表示されます 。
・拡張履歴: 最大500本までの過去の上位足を表示でき、長期的な市場構造の確認が可能です 。
・正確な位置合わせ: xloc.bar_time(時間座標)を使用しているため、市場の休場やギャップがあってもローソク足とヒゲが正しい時刻に配置されます 。
設定項目
・上位足の時間足 (Timeframe): 表示したい上位足を選択します(デフォルト: 240/4時間足)。
・表示する履歴本数: 過去何本分の上位足を表示するか設定します(最大500本)。
・スタイル設定: 上昇足・下降足の実体色、ヒゲの色、枠線の太さなどを自由にカスタマイズ可能です 。
・自動拡張モード (Auto Extend): 最新の50本に対して最適な透明度調整を自動で行います 。
技術的な注釈
・確定した過去足: リペイントしません(変化しません)。
・現在進行中の足: 確定するまではリアルタイムで形状が変化します。

Power Bar SMA Directional (Trade Your Edge)GENERAL OVERVIEW:
The Power Bar SMA Directional (Trade Your Edge) indicator identifies high-momentum Power Bars and uses a structured SMA-based breakout model to generate Long and Short trading signals. Once a signal appears, the indicator automatically places a Stop-Loss and three Take-Profit levels, with an optional dynamic trailing stop-loss. Alerts are available for every trade event.
This indicator was developed by Flux Charts in collaboration with Steven Adams (Trade Your Edge).
What is the purpose of the indicator?:
The purpose of the Power Bar SMA Indicator is to turn an unusually strong candle (Power Bar) into a complete, rule-based trade setup. The indicator does three main things, very specifically:
It spots “power bars”. These are candles where the body is both large compared to the candle’s own range and large compared to nearby candles.
It only cares about power bars when they align with the trend’s direction: bullish or bearish.
When that happens, the indicator gives a buy or sell signal with an entry at the signal candle, a stop-loss at the low/high of the power bar, and three take-profit targets placed at fixed multiples of the entry to stop-loss distance. You can also have the stop move up/down after each target is hit with the trailing stop-loss feature.
What’s the theory behind the indicator?:
The theory behind this indicator is that large, one-sided candles often mark the start of directional strength. When a candle’s body takes up most of its total range and exceeds the average size of recent candlesticks, it shows clear control from either buyers or sellers. The indicator combines this concept with a simple moving average to confirm trend direction, ensuring signals only align with the current bias. It then checks if price breaks a recent swing high or low to confirm momentum is continuing rather than consolidating inside a range. By combining three core elements: trend bias, momentum identification, and confirmation that price has room for new discovery beyond prior ranges, the indicator can focus on finding trade setups that have multiple market factors in alignment.
POWER BAR SMA DIRECTIONAL FEATURES:
The Power Bar SMA Directional indicator includes 4 main features:
Power Bars
Trend Bias
Long / Short Signals + Risk Management
Alerts
POWER BARS:
🔹What are Power Bars?:
Power Bars are large, high-momentum candles that show strength in one direction of the market. They form when a candle’s body (the distance between open and close) dominates most of the candle’s total range (the distance between high and low), meaning price moved strongly in one direction with little to no pullback. To qualify, the candle must also be large relative to nearby candles. This size difference confirms that the candle is a burst of momentum.
🔹How to interpret and use Power Bars:
When a Power Bar forms, it signals that price has just made a strong directional move with little to no pullback. Traders can use these bars to identify momentum shifts and potential trade setups.
A bullish Power Bar means buyers controlled the entire candle, marking the start of upward momentum. A bearish Power Bar means sellers were in control of the entire candle, signaling the start of downwards momentum. In the Power Bar SMA Directional indicator, these candles are only used for signals when they align with the market trend and satisfy other entry requirements, mentioned later on.
Bullish Power Bars forming above the Simple Moving Average (SMA) can signal potential long opportunities.
Bullish Power Bars forming below the SMA can signal potential short opportunities.
🔹How are Power Bars identified:
Power Bars are detected and confirmed only after the candle closes, ensuring that the full candlestick body and range can be measured. The indicator does not repaint or change past bars. Once a Power Bar is confirmed, it stays fixed on the chart. Power Bars can be detected on any timeframe or symbol that produces standard candlestick data.
The indicator identifies Power Bars using two user-defined inputs: Sensitivity and Body %.
◇ Sensitivity:
The Sensitivity setting determines how large a candle’s body must be relative to nearby candles. It uses the Average True Range (ATR) to compare the current candle’s size with recent candles, and the Sensitivity value acts as a multiplier of that ATR. A higher Sensitivity value means the candle must be much larger than recent candles to qualify, so fewer Power Bars will form. A lower value makes the filter less strict, allowing more candles to qualify.
◇ Body %:
The Body % setting controls what percentage of the candle’s total range must be body rather than Wick. A higher value requires the body to take up more of the candle’s total range, so fewer candles pass the filter. A lower value allows candles with more wick to qualify, so more Power Bars will form.
Body % Example:
If Body % is set to 50, the candle body must cover at least half of the candle’s total range. For example, if a candle’s high is $11, its low is $10, its open is $10.20, and its close is $10.80, then the total range is $1 ($11 - $10) and the body is $0.60 ($10.80 - $10.20). Body % = (Body / Total Range) * 100 = (0.60 ÷ 1.00 × 100) = 60%. Since 60% is greater than the input of 50%, this candle passes the Body % criteria.
Once a candlestick closes and it meets both the Sensitivity and Body % requirements, it will be plotted in a different color, using barcolor() function. Users can adjust the bullish/bearish colors of Power Bars by adjusting the ‘Candle Coloring’ setting. The Power Bar candle coloring is purely visual and does not affect signal logic or strategy calculations.
TREND BIAS:
The indicator uses a Simple Moving Average (SMA) to determine overall trend direction and ensure that long/short signals align with the market bias.
When the SMA is sloping upward and price is trading above it, the market is considered to be in a bullish trend. In this case, only long setups are allowed. When the SMA is sloping downward and price is below it, the market is considered bearish, and only short setups are valid. This filtering ensures that every signal follows the current trend rather than fighting it.
Within the settings, the SMA length can be customized to match different trading styles. A shorter SMA period reacts more quickly to price changes, making it better suited for scalping or lower timeframes where traders want faster entries and exits. A longer SMA period responds more slowly, which smooths out smaller fluctuations and is more useful for day traders or swing traders who focus on larger trends. By default, the SMA length is set to 20.
Signals on SEED_ALEXDRAYM_SHORTINTEREST2:NQ 5-minute timeframe with a 10 SMA vs. 100 SMA:
🔹Why does the indicator include a trend filter?:
This indicator is built around the assumption that markets tend to continue moving in their current direction. Thus, if the trend is bullish, it’s assumed that price will continue moving higher. If the trend is bearish, it’s assumed that price will continue moving lower. By combining the SMA filter with the momentum logic of the power bars, the indicator avoids countertrend setups. This keeps signals focused on continuation setups where both the trend and short-term strength (momentum) are in agreement.
LONG/SHORT SIGNALS:
This indicator identifies potential trade setups by combining momentum, trend alignment, and structural confirmation. It detects when a Power Bar candle appears, and then looks for confirmation that the move is valid through trend alignment and a structure break.
There are three long setups and three short setups:
Momentum Breakout
Proximity Breakout
Delayed Breakout
All setups require:
A valid Power Bar forming in the correct context relative to the SMA.
A break of nearby structure (defined by the Swing Length setting).
🔹Signal Settings:
◇ SMA Distance:
This setting defines how close a Power Bar must be to the SMA to qualify for the proximity breakout setup type. It measures the maximum allowed distance between the Power Bar’s open price and the SMA, expressed as a multiple of the Average True Range (ATR).
This setting only affects Setup #2 (Proximity Breakout) and sometimes Setup #3 (Delayed Breakout). Setup #1 does not use this filter because its logic depends on price crossing the SMA or confirming later. In proximity setups, the power bar candle must both open and close on the same side of the SMA (bullish or bearish) while still being within the allowed SMA Distance range. This condition prevents signals when price is stretched too far away from the SMA, which could indicate exhaustion or a potential pullback rather than continuation.
A lower SMA Distance value tightens this filter, allowing only Power Bars that form very close to the SMA, resulting in fewer but more conservative signals. A higher SMA Distance value gives wiggle room and allows setups that form farther from the SMA, generating more frequent signals.
In the example below, when the SMA Distance is set to 0.5 (left chart), the bullish Power Bar does not trigger a long signal because its opening price is too far from the SMA. When the SMA Distance is increased to 1.0 (right chart), the same candle now falls within the allowed range, making the setup valid and displaying a long signal label.
◇ Swing Length:
The Swing Length setting defines how the indicator identifies recent structure levels used for breakout confirmation. These structure levels are swing highs and swing lows, which represent points where price reversed direction over a specified number of bars. The indicator uses these high/low levels to determine whether price has broken past a meaningful area of prior support or resistance before confirming a trade setup.
The Swing Length value determines how far back the indicator looks when calculating these points. Internally, it uses the Highest/Lowest method, scanning the last N bars (where N is the Swing Length input) to find the highest high and lowest low within that range.
The highest high becomes the immediate resistance level for potential long setups.
The lowest low becomes the immediate support level for potential short setups.
A lower Swing Length value makes the indicator reference closer levels. This increases the number of potential signals because nearby highs and lows are easier for price to reach.
A higher Swing Length value references farther structure levels, typically major swing points, which reduces signal frequency.
Every setup requires a structure break for confirmation. The Swing Length setting directly affects how strict or lenient the entire indicator behaves for each setup type.
In Setup #1 (Baseline Momentum Breakout) and Setup #2 (Trend-Aligned Proximity Breakout), the Power Bar must break the structure level during or immediately after its formation.
In Setup #3 (Delayed Breakout Confirmation), the same Swing Length level is referenced for a limited number of candles defined by the Candles Between Confirmation setting.
◇ Candles Between Confirmation:
The Candles Between Confirmation setting defines how long the indicator will wait for price to confirm a breakout after a qualifying Power Bar forms. It represents the maximum number of bars allowed between the Power Bar’s close and the moment when price breaks the nearby structure level, which is derived from the Swing Length setting. The structure level is defined as the most recent swing high (for long setups) or swing low (for short setups).
If a structure break occurs within the specified window, a valid signal is triggered, and the Long or Short label is plotted at the close of the breakout candle. If price fails to break through the level within a certain number of candles, the setup is invalidated. This ensures that signals only appear when momentum follows through promptly, and not when price stalls or consolidates for an extended period.
Lower values make confirmations stricter, capturing only quick momentum breakouts. Higher values allow more time for slower markets or higher timeframes to complete structure breaks. Adjust this setting based on market volatility and trading style.
In the example below, when Candles Between Confirmation is set to 10, no signal appears because price breaks the swing high after 15 bars, which is greater than the allowed limit. When the setting is increased to 15, the same move qualifies, and a long signal is triggered as price breaks the swing high 15 candles after the initial bullish Power Bar that crossed the SMA.
🔹Long Setups:
Long Setup #1: Momentum Breakout
A bullish Power Bar opens below the SMA, and closes above it, showing buyer strength.
A breakout must occur during this bullish Power Bar candle through a nearby resistance level derived from the Swing Length setting.
When this breakout occurs, a Long Signal appears at bar close.
After a signal appears, three take-profit levels and one stop-loss level are also plotted.
Stop-Loss: Placed at the Power Bar’s low.
Take-Profit 1: Set using a 1:1 risk distance from the Stop-Loss to entry.
Take-Profit 2: Extends to 1:1.5 risk-to-reward.
Take-Profit 3: Extends to 1:2 risk-to-reward.
(Power Bars are white in this image)
Long Setup #2: Proximity Breakout
A bullish Power Bar opens and closes above the SMA, but is still close enough to it to show price hasn’t extended too far. (Refer to SMA Distance setting). As long as the opening of that candle is within the SMA Distance threshold, the setup remains valid.
The bullish Power Bar candle must break through the recent swing high (refer to Swing Length setting).
A Long Signal triggers when that breakout is confirmed.
After a signal appears, three take-profit levels and one stop-loss level are also plotted, similar to Long Setup #1.
(Power Bars are white in this image)
Long Setup #3: Delayed Breakout
A bullish Power Bar appears in a valid location (Refer to Long Setup #1 or Long Setup #2), but structure is not broken immediately.
The indicator waits for confirmation within the maximum Candles Between Confirmation window. If price breaks structure within that time, a Long Signal appears. If price fails to break structure in time, the setup is discarded.
Risk Management:
Same Stop-Loss, TP 1, TP 2, and TP 3 logic as Long Setup #1
(Power Bars are white in this image)
🔹Short Setups:
Short Setup #1: Momentum Breakout
A bearish Power Bar opens above the SMA, and closes below it, showing seller strength.
A breakout must occur during this bearish Power Bar candle through a nearby support level derived from the Swing Length setting.
When this breakout occurs, a Short Signal appears at bar close.
After a signal appears, three take-profit levels and one stop-loss level are also plotted.
Stop-Loss: Placed at the Power Bar’s high.
Take-Profit 1: Set using a 1:1 risk distance from the Stop-Loss to entry.
Take-Profit 2: Extends to 1:1.5 risk-to-reward.
Take-Profit 3: Extends to 1:2 risk-to-reward.
(Power Bars are white in this image)
Short Setup #2: Proximity Breakout
A bearish Power Bar opens and closes below the SMA, but is still close enough to it to show price hasn’t extended too far. (Refer to SMA Distance setting). As long as the opening of that candle is within the SMA Distance threshold, the setup remains valid.
The bearish Power Bar candle must break through the recent swing low (refer to Swing Length setting).
A Short Signal triggers when that breakout is confirmed.
After a signal appears, three take-profit levels and one stop-loss level are also plotted, similar to Short Setup #1.
(Power Bars are white in this image)
Short Setup #3: Delayed Breakout
A bearish Power Bar appears in a valid location (Refer to Short Setup #1 or Short Setup #2), but structure is not broken immediately.
The indicator waits for confirmation within the maximum Candles Between Confirmation window. If price breaks structure within that time, a Short Signal appears. If price fails to break structure in time, the setup is discarded.
Risk Management:
Same Stop-Loss, TP 1, TP 2, and TP 3 logic as Long Setup #1
(Power Bars are white in this image)
🔹Trailing Stop-Loss Feature:
When the Trailing Stop-Loss setting is enabled, the Stop-Loss (SL) automatically adjusts as price reaches take-profit levels. This feature helps secure profits while keeping the trade logic completely rule-based and non-discretionary.
Here’s exactly how it works step-by-step:
Initial Stop-Loss placement:
For a Long trade, the initial SL is set at the low of the bullish Power Bar that triggered the setup.
For a Short trade, the initial SL is set at the high of the bearish Power Bar that triggered the setup.
This level stays fixed until one of the Take-Profit targets is reached.
After TP 1 is hit:
The SL automatically moves to the entry price (breakeven).
After TP2 is hit:
The SL automatically moves to TP 1
Final exit condition:
The trade is considered complete once either the trailing Stop-Loss or TP 3 is reached.
🔹Visualization:
Users can enable or disable:
Long Signals
Short Signals
Take-Profit Lines
Take-Profit Labels
Stop-Loss Lines
Stop-Loss Labels
Signal Line
SMA
◇ Signal Line:
The Signal Line is an optional visual feature that helps users see exactly which structure level the indicator is using to confirm a breakout. It does not change how signals are generated. It only displays the reference point on the chart.
Users can customize the Signal Line style (Dashed, Dotted, Solid) and choose different colors for bullish and bearish signal lines. The Signal Line can also be turned off completely. When disabled, signals will not be affected.
ALERTS:
The indicator supports alerts, so you never miss a key market move. You can choose to receive alerts for each of the following conditions:
Long Signal
Short Signal
TP 1 (Take-Profit 1)
TP 2 (Take-Profit 2)
TP 3 (Take-Profit 3)
SL (Stop-Loss)
UNIQUENESS:
This indicator automates a strategy that is normally managed manually using multiple steps: identifying large momentum candles, validating trend direction, confirming breakout strength through structure, and then projecting clean risk-based targets. The SMA Distance filter, confirmation window, and swing structure rules work together to ensure signals only trigger when momentum (Power Bars) aligns with technical levels. This indicator turns Power Bars into complete trade ideas with real-time SL/TP management and alerts.

Asia/London/NY Session Slope LinesTITLE: Asia/London/NY Session Slope Lines
Track momentum across all three major trading sessions with automated slope lines showing pips per bar movement.
📊 VISUALIZE SESSION MOMENTUM AT A GLANCE
This powerful indicator automatically draws slope lines for all three major forex trading sessions (Asia, London, and New York), giving you instant insight into directional bias and momentum for each session.
✨ KEY FEATURES:
• Three Session Coverage - Asia, London, and New York sessions tracked simultaneously
• Pips Per Bar Calculation - See exact momentum as "pips moved per bar" for easy comparison
• Customizable Styling - Different colors, line styles, and widths for each session
• Auto-Detection - Automatically identifies session boundaries and draws lines
• Clean Labels - Each session displays its slope value directly on the chart
• Session Markers - Optional triangles show exact start/end of each session
📈 HOW IT WORKS:
The indicator calculates the slope by measuring:
1. Price movement during the entire session (in pips)
2. Number of bars in that session
3. Result: Pips per bar (momentum strength)
Example: If Asia session moved +30 pips over 60 bars = +0.50 pips/bar slope
🎨 VISUAL CLARITY:
• Asia Session: Solid lines (Green/Red by default)
• London Session: Dashed lines (Blue/Orange by default)
• New York Session: Dotted lines (Lime/Fuchsia by default)
• Positive slopes = Bullish momentum
• Negative slopes = Bearish momentum
🔧 FULLY CUSTOMIZABLE:
• Adjust session times for any timezone
• Change colors for positive/negative slopes per session
• Toggle session boundary markers on/off
• Modify line width and style independently
💡 PERFECT FOR:
✓ Session traders who focus on specific market hours
✓ Identifying which session has the strongest momentum
✓ Spotting trend continuation or reversal between sessions
✓ Comparing volatility across different trading sessions
✓ Finding the best session for your trading strategy
⚙️ WORKS WITH:
• All forex pairs (EUR/USD, GBP/USD, USD/JPY, etc.)
• Any timeframe (works best on 5m-1H charts)
• Automatically adjusts pip calculation for JPY pairs
🚀 QUICK SETUP:
1. Add indicator to chart
2. Customize session times if needed (Settings → Input tab)
3. Adjust colors and styles (Settings → Style tab)
4. Start trading with clear session momentum insight!
No complex configuration needed - works perfectly with default settings!
🚀 QUICK START GUIDE - Asia/London/NY Session Slope Lines
──────────────────────────────────────────────────────────────
STEP 1: ADD TO CHART
──────────────────────────────────────────────────────────────
1. Open TradingView
2. Select any forex pair (e.g., EUR/USD)
3. Click "Indicators" at top of chart
4. Search: "Asia/London/NY Session Slope Lines"
5. Click to add to chart
──────────────────────────────────────────────────────────────
STEP 2: UNDERSTAND WHAT YOU SEE
──────────────────────────────────────────────────────────────
You'll see THREE different slope lines per day:
📍 ASIA SESSION (Solid Line)
• Default: 00:00 - 09:00 (Exchange time)
• Green = Bullish | Red = Bearish
• Label shows: "Asia +0.85 pips/bar"
📍 LONDON SESSION (Dashed Line)
• Default: 03:00 - 12:00 (Exchange time)
• Blue = Bullish | Orange = Bearish
• Label shows: "London -1.23 pips/bar"
📍 NEW YORK SESSION (Dotted Line)
• Default: 09:30 - 16:00 (Exchange time)
• Lime = Bullish | Fuchsia = Bearish
• Label shows: "NY +2.14 pips/bar"
──────────────────────────────────────────────────────────────
STEP 3: HOW TO READ THE SLOPES
──────────────────────────────────────────────────────────────
The number tells you MOMENTUM STRENGTH:
+0.10 to +0.50 pips/bar = Weak uptrend
+0.50 to +1.50 pips/bar = Moderate uptrend
+1.50+ pips/bar = Strong uptrend
-0.10 to -0.50 pips/bar = Weak downtrend
-0.50 to -1.50 pips/bar = Moderate downtrend
-1.50+ pips/bar = Strong downtrend
──────────────────────────────────────────────────────────────
STEP 4: TRADING STRATEGIES
──────────────────────────────────────────────────────────────
✅ CONTINUATION PLAY:
If Asia = +1.2 pips/bar AND London = +0.8 pips/bar
→ Look for LONG entries during NY session
✅ REVERSAL PLAY:
If Asia = +2.5 pips/bar (strong) AND London = -0.3 pips/bar
→ Momentum shifted, watch for reversal
✅ STRONGEST SESSION:
Compare all three slopes - trade during the session with highest absolute value
NY = +3.2 pips/bar > London = +1.1 > Asia = +0.4
→ NY session has strongest momentum
──────────────────────────────────────────────────────────────
STEP 5: CUSTOMIZE (OPTIONAL)
──────────────────────────────────────────────────────────────
Click the gear icon ⚙️ next to indicator name:
🕐 ADJUST SESSION TIMES:
Settings → Asia Session → Change hours
(Use YOUR timezone or exchange timezone)
🎨 CHANGE COLORS:
Settings → Asia/London/NY Style → Pick colors
👁️ HIDE MARKERS:
Settings → Display Options → Uncheck "Show Session Markers"
──────────────────────────────────────────────────────────────
STEP 6: BEST PRACTICES
──────────────────────────────────────────────────────────────
📊 Use on 5-minute to 1-hour charts
(Too high timeframe = not enough bars per session)
💱 Works best on major forex pairs
(EUR/USD, GBP/USD, USD/JPY, etc.)
🕐 Verify session times match your trading timezone
(Default is exchange timezone)
📈 Combine with support/resistance levels
(Strong slope + key level = high probability setup)
