ODTE Layman Signals 📌 Script Name
Layman Options Signals – Structured BUY CALL / BUY PUT with SL & TP
📖 Overview
This indicator is a complete, finished intraday trading system designed to simplify options trading (including 0DTE and weekly options) by converting price action and market structure into clear, actionable signals.
The script performs all analysis in the background and displays only what the trader needs to execute consistently:
BUY CALL or BUY PUT
Predefined Stop Loss (SL)
Two Take Profit levels (TP1 and TP2)
Trade status and levels displayed in a live status box
The focus of this tool is execution discipline, not prediction.
🧠 Core Concepts Used (What Makes This Script Original)
This script combines multiple price-action concepts into a single, rule-based framework:
1️⃣ Opening Range Breakout (ORB)
The script calculates the opening range high and low using the first X minutes of the regular session.
Trades are only allowed above ORB high for CALLs and below ORB low for PUTs.
This filters low-quality trades during early chop.
2️⃣ Market Structure Confirmation
CALL trades require higher highs and higher lows
PUT trades require lower lows and lower highs
This prevents trading against structure.
3️⃣ Retest & Liquidity Sweep Validation
Breakouts are validated using:
ORB retests (price accepts above/below the range)
Liquidity sweeps (false breakouts that trap traders)
This helps reduce fake breakouts.
4️⃣ Volatility-Aware Risk Management
Stop losses are placed using market structure + ATR buffer
This avoids stops being placed at obvious levels.
5️⃣ Multi-Target Trade Management
TP1 = partial profit (risk reduction)
TP2 = runner target (trend continuation)
After TP1, stop loss can move to breakeven (optional)
6️⃣ Discipline Controls
Only one active trade at a time
Cooldown period after a stop loss
Prevents over-trading and revenge trading
📊 What the Indicator Displays
The script plots the following directly on the chart:
Entry level
Stop Loss (SL)
Take Profit 1 (TP1)
Take Profit 2 (TP2)
Opening Range High & Low
It also includes a Status Box that always shows one of the following states:
WAIT
BUY CALL
BUY PUT
IN TRADE
COOLDOWN
This allows traders to understand the current state at a glance without reading code.
▶️ How to Use the Indicator
Recommended Timeframes
1-minute or 2-minute charts
Intraday use only
Entry Rules
When BUY CALL appears → Buy an ATM or slightly ITM call
When BUY PUT appears → Buy an ATM or slightly ITM put
Risk Management
Exit immediately if price hits the SL line
Take partial profits at TP1
Hold remaining position for TP2 if conditions allow
When Status Shows WAIT or COOLDOWN
No trade should be taken
⚙️ Recommended Instruments
SPY / QQQ
Liquid large-cap stocks
Intraday options (0DTE / weeklies)
⚠️ Important Disclaimer
This script is provided for educational purposes only.
It is not financial advice
It does not guarantee profits
It does not place trades automatically
Options trading involves significant risk
Always test using paper trading or small size before live use.
🎯 Who This Script Is For
✔ Traders who want clear rules
✔ Traders who prefer price action over indicators
✔ Options traders who value risk management
✔ Users who want less chart clutter and more discipline
❌ Not intended for swing trading
❌ Not intended for automated trading systems
🧩 Final Notes
This is a complete, finished indicator, not a test or experimental script.
All logic is deterministic, non-repainting, and designed for real-time use.
The philosophy behind this tool is simple:
Good trading comes from structure, discipline, and risk control — not prediction.
Candlestick analysis

Key Levels - BlackDelta.ioPivots Point of high interest these line are not ordinary lines they are indicating HTF Weekly levels, Base you trading ideas around these Key Levels to gain higher probability setup's once price touches one these Key Levels get ready for a big move to continuation or a reversal, pair it with your other confluences to get more edge in the market.
if this indicator helped you leave a comment below :)
@BlackDelta_

MA Candle Color [TheScalpingAnt]MA Candle Color
OVERVIEW
MA Candle Color is a visual indicator that transforms your trading experience by providing instant, real-time feedback on price position relative to your chosen Moving Average.
What makes it unique?
• Real-time visual clarity: The current forming candle changes color dynamically based on its position relative to the MA
• Zero lag: Instant visual feedback as price moves
• Clean charts: Only the active candle is colored - no chart clutter
• Professional design: Sleek, minimalist approach that enhances decision-making
Perfect for:
• Day traders seeking instant trend confirmation
• Scalpers who need split-second decision support
• Swing traders monitoring trend alignment
• Any trader who values visual clarity and speed
CONCEPTS
The Power of Visual Trading
Traditional indicators require constant interpretation. MA Candle Color eliminates this cognitive load by providing instant visual feedback through intelligent candle coloring.
Core Principle
The indicator operates on a simple but powerful concept:
• Green Candle = Price is above the Moving Average (bullish territory)
• Red Candle = Price is below the Moving Average (bearish territory)
Why Only the Current Candle?
-Unlike other indicators that color all candles, MA Candle Color focuses exclusively on the NOW:
-Eliminates visual noise
-Keeps your focus on current market conditions
-Prevents analysis paralysis
-Maintains clean chart aesthetics
-The Moving Average Foundation
-Moving Averages are one of the most trusted tools in technical analysis. This indicator leverages reliability while adding a modern, intuitive visual layer.
FEATURES
Real-Time Dynamic Coloring
• Current candle changes color instantly as it forms
• Green when price crosses above MA
• Red when price crosses below MA
• Automatic color reset when candle closes
Precision Engineering
• Zero repainting - what you see is what you get
• Lightweight code - no performance impact
• Compatible with all timeframes and instruments
Full Color Customization
-Choose your own bullish color (default: vibrant green)
-Choose your own bearish color (default: professional red)
-Match your chart theme perfectly
-High visibility options for all screen types
-Clean Visual Design
-MA plotted as subtle gray line
-Works seamlessly with other indicators
CUSTOMIZATION
Complete Control Over Your Trading Experience
MA Length (Default: 8)
Adjust from 1 to any value
Shorter periods (5-20): Responsive, ideal for scalping/day trading
Medium periods (20-50): Balanced for swing trading
Longer periods (50-200): Trend following and position trading
MA Type (Default: EMA)
• SMA: Best for identifying major support/resistance levels, classic, smooth trend identification
• EMA: Ideal for fast-moving markets and quick trend changes, responsive to recent price action
• WMA: Great for balanced trend analysis, balanced approach with recent price emphasis
• VWMA: Perfect when volume analysis is crucial, incorporates volume for institutional insight
• HMA: Excellent for reducing noise in volatile markets, incorporates volume for institutional insight
Recommended Configurations
For Day Trading:
• MA Length: 8-13
• MA Type: EMA or HMA
• High contrast colors
For Swing Trading:
• MA Length: 21-50
• MA Type: EMA or SMA
• Professional, subtle colors
For Scalping:
• MA Length: 5-8
• MA Type: EMA or HMA
• Bright, high-visibility colors
USAGE
Getting Started (3 Simple Steps)
Step 1: Add to Chart
• Search "MA Candle Color" in TradingView indicators
• Click to add to your chart
• Indicator loads with optimized default settings
Step 2: Customize (Optional)
• Click the settings gear icon
• Adjust MA length to match your trading timeframe
• Select your preferred MA type
• Choose your custom colors
Step 3: Trade with Confidence
• Watch the current candle color in real-time
• Green = Bullish momentum (price above MA)
• Red = Bearish momentum (price below MA)
• Use as confirmation with your existing strategy
Trading Applications
Trend Confirmation
• Green candle confirms uptrend continuation
• Red candle confirms downtrend continuation
• Color changes signal potential trend shifts
Entry Timing
• Enter long when candle turns green with other confirmations
• Enter short when candle turns red with other confirmations
• Use as a filter to avoid counter-trend trades
Exit Signals
• Exit longs when candle turns red
• Exit shorts when candle turns green
• Protect profits by respecting color changes
Multi-Timeframe Analysis
• Use on higher timeframe for trend direction
• Use on lower timeframe for precise entries
• Align colors across timeframes for high-probability setups
Pro Tips
Combine with Support/Resistance: Use color changes at key levels for powerful signals
Volume Confirmation: Look for color changes with volume spikes for stronger moves
Multiple MAs: Add multiple instances with different lengths (e.g., 8 EMA, 21 EMA, 50 SMA)
Risk Management: Never trade on color alone - use proper stop losses and position sizing
CONCLUSION
Why MA Candle Color is Essential for Modern Traders?
In today's fast-paced markets, speed and clarity are everything. MA Candle Color delivers both by transforming complex Moving Average analysis into instant visual feedback.
Key Benefits Recap
-Faster Decision Making - No more mental calculations
-Reduced Errors - Visual clarity prevents mistakes
-Professional Appearance - Clean, distraction-free charts
-Universal Application - Works with any strategy or market
-Fully Customizable - Adapts to your exact needs
-Zero Repainting - Reliable, honest signals
-Lightweight - No performance impact
Who Benefits Most?
-Day Traders: Instant trend confirmation for quick entries/exits
-Scalpers: Split-second visual feedback for rapid trading
-Swing Traders: Clear trend alignment across timeframes
-Beginners: Simplified MA analysis without complexity
-Professionals: Clean visual layer for existing strategies
The Competitive Edge
While others are calculating price vs MA in their heads, you'll have instant visual confirmation. While they're second-guessing crossovers, you'll be executing with confidence. While their charts are cluttered with colored history, yours will be clean and focused on NOW.

First Candle Range (FCR) Gold Strategy - EtubersThe 18:00 (6:00 PM) candle is widely used by traders in the Forex and Futures markets because it marks the New York market rollover and the start of the Asian session.
How the Strategy Works:
- The Range: The High and Low prices of the 1-hour candle (18:00–19:00) create a "Supply and Demand" zone.
- The Breakout: A candle closing above the high signals a bullish breakout; a candle closing below the low signals a bearish breakout.
- Institutional Memory: By extending this zone forward for 4 days, traders can identify where "old" 18:00 levels act as support or resistance in the future.
- Execution: Traders often wait for a breakout followed by a "retest" of the box boundary to enter a high-probability trade.


ORB With PDHL and Multi EMAOpen range with EMAs.
Labels are positioned a few bars to the right of the most recent candle, aligned with each moving average. This keeps the labels visually connected to their lines without overlapping price action or candles.

BB Breakout [DemaK] BB Breakout is a volatility and intrabar activity indicator that combines Bollinger Band breakout context with an internal candle Point of Control (POC) derived from lower-timeframe data.
The indicator is designed to help traders identify expansion phases, price acceptance outside statistical ranges, and where volume concentrated inside each candle during those conditions.
Bollinger Breakout Context
The script plots a standard Bollinger Band structure and highlights conditions where price moves outside the upper or lower band. When this occurs:
The chart background is shaded to visually mark bullish or bearish breakout zones.
These zones help identify moments of increased volatility or directional pressure.
The Bollinger Bands serve as a statistical volatility framework, providing context rather than trade signals.
Candle POC Overlay
In addition to the breakout zones, the indicator plots a single price level per candle representing the candle’s internal Point of Control.
This level is derived from lower-timeframe price and volume behavior and highlights the price where the strongest participation occurred during the formation of the candle. The POC offers insight into:
Intrabar balance and imbalance
Areas of acceptance within high-volatility conditions
Potential short-term reaction levels
Optional labels can display basic volume and delta-related information for traders who want additional context.
How to use it
Use Bollinger breakout zones to identify volatility expansion.
Observe how price interacts with the candle POC during and after breakouts.
Combine both elements to assess whether breakouts show acceptance or rejection at key intrabar levels.
Notes
The indicator does not include VWAP calculations.
Lower-timeframe data availability may affect precision depending on symbol and exchange.
BB Breakout is intended as a contextual analysis tool, not a signal generator. It provides structured visual information that allows traders to interpret price behavior during volatility expansions using their own trading approach.

Candle POC [DemaK]Candle POC is a volume-based indicator that identifies the Point of Control (POC) inside each candle by analyzing lower-timeframe volume distribution. Instead of assuming that volume is evenly distributed across the candle range, this script reconstructs how volume behaved internally using lower timeframe data.
How it works
For every higher-timeframe candle, the indicator requests data from a lower timeframe and separates volume into:
Buy volume (candles closing above open)
Sell volume (candles closing below open)
Neutral volume (candles closing equal to open)
The script then:
Aggregates bullish and bearish volume within the candle.
Calculates volume delta (buy volume minus sell volume).
Normalizes the delta relative to total volume.
Locates the price level where the strongest volume imbalance occurred, which is treated as the candle’s Point of Control.
This POC represents the price level where market participation was most aggressive during the candle, highlighting areas of acceptance or rejection.
What is plotted
A single price level per candle representing the internal volume POC.
Optional detailed labels showing:
Total volume
Volume delta
Delta percentage relative to total volume
How to use it
The Candle POC can act as a short-term support or resistance level.
It is useful for identifying intracandle balance zones, absorption, and momentum shifts.
Traders can combine it with price action or market structure to confirm entries, exits, or areas of interest.
Notes
The indicator always uses lower-timeframe data to improve precision.
Results depend on the availability and quality of lower-timeframe volume data provided by the symbol and exchange.

Multi-EMA ATR Channel (Custom)指标内置 EMA21 / EMA55 / EMA100 / EMA200 四条均线:
EMA21:短期价格动量与通道核心
EMA55 / EMA100:中期趋势结构参考
EMA200:长期趋势方向过滤
通道颜色由 MACD 金叉 / 死叉 控制:
绘制通道,保持金叉后绿色,死叉后红色
The indicator includes four EMAs (21 / 55 / 100 / 200):
EMA 21: short-term momentum and channel core
EMA 55 & EMA 100: medium-term trend structure
EMA 200: long-term trend filter
Channel color is driven by MACD cross signals:
Green channel: bullish momentum after MACD bullish crossover
Red channel: bearish momentum after MACD bearish crossover


Market Structure [BOS/ChoCh Line & Bar-Chart]Overview
A comprehensive market structure indicator that identifies Break of Structure (BOS) and Change of Character (CHoCH) patterns - essential concepts in Smart Money trading methodology.
━━━━━━━━━━━━━━━━━━━━━━━━━━━━━━━━━━━━━━━━
🔹 KEY FEATURES
Two detection modes: Swing-based (High/Low) and Line Chart-based (Close)
Automatic HH/LL/LH/HL labeling with price and percentage change
BOS (Break of Structure) for trend continuation
CHoCH (Change of Character) for trend reversals
Market Structure Candle Coloring (MSC)
Optional Line Chart overlay
Fully customizable colors and display options
Built-in alerts for BOS and CHoCH events
━━━━━━━━━━━━━━━━━━━━━━━━━━━━━━━━━━━━━━━━
🔹 DETECTION MODES
Swings Mode
Uses candlestick highs and lows to identify swing points. This is the traditional approach and works well for most trading styles.
Line Chart Mode
Uses closing prices only to identify peaks and troughs - similar to how a line chart displays price action. This mode filters out wicks and can provide cleaner structure identification.
━━━━━━━━━━━━━━━━━━━━━━━━━━━━━━━━━━━━━━━━
🔹 STRUCTURE LABELS
HH (Higher High) - Price made a new high above the previous high → Bullish
HL (Higher Low) - Price made a higher low → Bullish
LH (Lower High) - Price failed to make a new high → Bearish
LL (Lower Low) - Price made a new low below the previous low → Bearish
━━━━━━━━━━━━━━━━━━━━━━━━━━━━━━━━━━━━━━━━
🔹 BOS vs CHoCH
BOS (Break of Structure)
A continuation signal. Occurs when price breaks a key level in the direction of the current trend.
Bullish BOS: Price closes above the last swing high during an uptrend
Bearish BOS: Price closes below the last swing low during a downtrend
CHoCH (Change of Character)
A reversal signal. Occurs when price breaks the key level that would invalidate the current trend.
Bullish CHoCH: During a downtrend, price closes above the high that produced the last Lower Low
Bearish CHoCH: During an uptrend, price closes below the low that produced the last Higher High
━━━━━━━━━━━━━━━━━━━━━━━━━━━━━━━━━━━━━━━━
🔹 CANDLE COLORING (MSC)
When enabled, candles are colored based on the current market structure trend:
Bullish trend: Candles colored in the bullish color
Bearish trend: Candles colored in the bearish color
Trend-conforming candles appear solid, counter-trend candles appear faded
Note: For best results, go to Chart Settings → Symbol and set Body/Border/Wick colors to transparent.
━━━━━━━━━━━━━━━━━━━━━━━━━━━━━━━━━━━━━━━━
🔹 SETTINGS
Market Structure Settings
Detection Mode - Choose between Swings or Line Chart
Swing Length - Sensitivity of pivot detection (higher = less sensitive)
Show BOS / Show CHoCH - Toggle display of each pattern type
Line Chart Display
Show Line Chart - Display the close-based line overlay
Line Chart Color / Width - Customize appearance
Labels & Extra Data
Show HH/LL/LH/HL Labels - Toggle swing point labels
Show Price at Pivots - Display price values
Show % Change - Display percentage change between swings
━━━━━━━━━━━━━━━━━━━━━━━━━━━━━━━━━━━━━━━━
🔹 ALERTS
The indicator includes alerts for:
Bullish/Bearish BOS
Bullish/Bearish CHoCH
━━━━━━━━━━━━━━━━━━━━━━━━━━━━━━━━━━━━━━━━
🔹 USAGE TIPS
Use higher Swing Length values on higher timeframes to filter noise
CHoCH signals potential trend reversals - consider waiting for confirmation
BOS signals trend continuation - can be used for entries in the trend direction
Combine with other confluence factors like support/resistance, order blocks, or volume analysis
The Line Chart mode can help identify structure on volatile instruments where wicks create noise
For best display of bar coloring set Visual Order -> Bring to Front

Key High/Low liquidity @sheershThe Key High/Low ICT by @sheersh169sharma indicator is designed to identify key liquidity levels across multiple timeframes and custom trading sessions. It provides precise visualization of historical highs and lows to assist in technical analysis.
## Key Features
* Multi-Timeframe Support: Automatically plots Previous Day, Week, 4-Hour, and 1-Hour levels.
* Custom Sessions: Supports up to 6 independently configurable time windows.
* Precise Anchoring: Lines originate exactly from the time the high or low formed.
* Mitigation Logic: Options to terminate lines upon price interaction or extend them indefinitely.
## Configuration Guide
### Standard Timeframes
Users can toggle and customize the following levels:
* Previous Day High/Low
* Previous Week High/Low
* Previous 4-Hour High/Low
* Previous 1-Hour High/Low
Each level allows for customization of visibility, color, and line style (Solid, Dashed, Dotted).
### Custom Sessions
The indicator supports 6 distinct custom sessions, ideal for defining specific market hours (e.g., Asia, London, New York).
Setup Instructions:
1. Navigate to the desired Session group in settings (e.g., Session 1).
2. Enable the session.
3. Define the time range in HHMM-HHMM format (e.g., 0930-1600).
4. Assign custom labels for identification.
5. Select line colors and styles.
### Extension Logic
The "Extend until Mitigated Only" setting controls how lines are drawn:
* Disabled (Default): Lines extend from the custom timeframe to the current chart bar.
* Enabled: Lines terminate strictly at the point where price touches the level.
### Visual Settings
* Line Width: Adjusts the thickness of all indicator lines globally.
* Labels: Text labels are positioned to the right of the lines to maintain chart clarity.

Smart S/R Levels [Stansbooth]
Introducing the Ultimate Support & Resistance Indicator for Live Market Analysis!
Unlock the power of real-time market insights with our cutting-edge Support & Resistance Indicator! Designed for traders who demand precision and clarity, this tool automatically plots key support and resistance levels on your chart, ensuring you never miss crucial price action points.
🚀 Key Features:
Real-Time Tracking: Accurately identifies and updates support & resistance levels as market conditions evolve.
Easy-to-Use: Simple integration into your TradingView charts with no complicated setup.
Customizable Alerts : Get notified when the price approaches key levels for actionable trading opportunities.
Accurate & Reliable : Built using advanced algorithms for pinpoint precision in real-time market conditions.
Time-Saving: Automatically draws support and resistance lines, so you can focus on strategy and execution.
Whether you’re a day trader, swing trader, or a long-term investor, this indicator is designed to give you the edge by highlighting the most important levels for price reversals and breakouts.
Start trading smarter today with the Support & Resistance Indicator —your ultimate market companion!

30-Point Price RaysThis indicator plots 2 lines 30 points away from the current price.
This indicates where to place your limit orders pre news.
A simple tool just to help and not something to be used outside of evaluations.

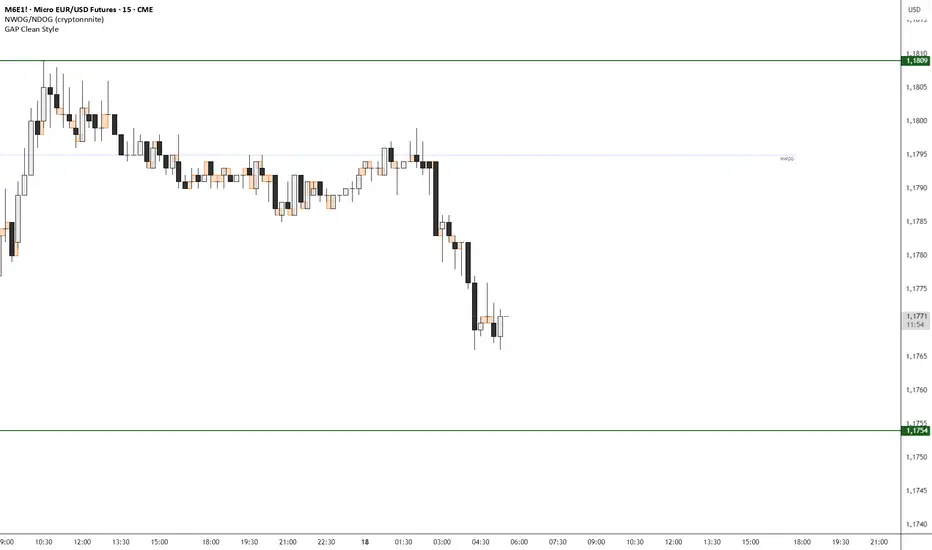
GAP Clean StyleIt simply indicates the gaps between closing/opening candles, without taking wicks into account.
Anti-Climax and DecelerationThis indicator detects high-probability 3-bar price sequences to highlight potential market turning points, continuations, and expansions. It identifies four types of triangle patterns based on the relationship between three consecutive bars:
1. Break Triangles
Signal potential reversals after a short sequence.
Example: Bear → Bear → Bull or Bull → Bull → Bear.
Plotted as Green (UP) / Red (DOWN) triangles.
2. Compression Triangles
Detect inside / absorption setups where price is consolidating before a possible directional move.
Example: Bars staying within Bar 1’s high/low range.
Plotted as Orange dots.
3. Expansion Triangles
Identify strong continuation moves, where each bar breaks the high/low of the previous bar in the same direction.
Plotted as Purple dots.
Features:
Non-repainting, bar-close confirmed signals.
Works on any timeframe.
Easy visual cues for Break, Compression, and Expansion patterns.
Designed to integrate with SMC concepts, FVG, or Swing Point analysis.
How to Use:
Look for triangle or dot signals at key support/resistance or supply/demand zones.
Combine with trend direction or higher timeframe bias for higher-probability trades.
Use Break signals for reversal setups, Compression signals for absorption or liquidity hunts, and Expansion signals for strong trend continuation.

Short-Term Swing KingDisclaimer!!!
This script and indicators do not constitute any financial advice. Traders are fully responsible for their own trading decisions, and the script developer is not liable for any losses or gains resulting from the use of this script. Please use with caution and trade rationally. Fans of Chan Theory are welcome to learn and communicate together. QQ: 2508126812

Zone Eleven HTF Gate SweepThis indicator is designed as a simple visual framework rather than a rigid signal system. It highlights time-based structure and key alignment zones to help identify when price behavior is more likely to be active or responsive. The logic is intentionally flexible, allowing the user to apply their own discretion instead of relying on strict conditions. Its primary value is visual clarity and context, not automatic entries or exits.

CCI 34 IndicatorThis tool plots the 34 period CCI to help study momentum and price strength versus its recent average.
It is meant only for educational analysis and should not be treated as a buy/sell signal or investment advice.
Traders must use their own judgment, risk management, and additional tools before making decisions.
Short Explanation of Levels
CCI > +100
= strong upside momentum; price is trading above its recent average and demand is dominant.
CCI < −100
= strong downside momentum; price is below its recent average and selling pressure is dominant.

Destiny Atlas Energy Navigation PRO - Destiny QuantDestiny Atlas Energy Navigation PRO - Destiny Quant | 【天機圖】能量導航
English Description
Visualizing Market Momentum. Destiny Atlas Energy Navigation PRO is the ultimate guide for trend followers. By replacing traditional candles with high-visibility "Energy Bricks" (Neon Blue & Flowing Gold), it allows traders to filter market noise and ride the trend with absolute clarity.
The Pro Tracker: Built-in professional dashboard tracks your Entry Price, Duration, and Floating PnL.
Momentum Logic: Powered by the V22 core engine, synchronizing Daily, Weekly, and Monthly cycles.
Visual Clarity: Optimized for dark mode, providing a high-end quantitative terminal experience.
中文說明
市場動能的導引之圖 【天機圖】能量導航 PRO 是順勢交易者的終極指引。本指標以具備極高辨識度的 「實心能量磚」(天機藍與流金色)取代傳統 K 線,協助交易者過濾雜訊,清晰捕捉每一段趨勢。
專業持倉監控:內建數據面板,自動追蹤進場價、持倉天數與即時損益。
動能核心:搭載 V22 運算核心,完美同步日、週、月線的多週期共振。
極致美學:專為深色模式優化,營造專業級量化交易終端機的視覺質感。
🚀 Get Access / 獲取授權 This is an Invite-only script. To unlock the Celestial Mirror, please:
Visit the link in my profile.
Send a direct message for subscription details.
本指標為 僅限邀請 (Invite-only)。欲獲取授權,請:
點擊我個人主頁的連結(官網/商店)。
透過 TradingView 私訊聯繫我了解訂閱詳情。

GS Tactical Overlay (SMC + Squeeze)designed to sit atop the 6 pillar commander. it will tell you signs for puts and calls

avax by dionfor adding liquidity for view the trend then avax foundation adding liquidity whats the price action
