iDea Stochastic Divergence Pro iDea TradeThis indicator automatically detects and highlights bullish and bearish divergences using the Stochastic oscillator.
Main features:
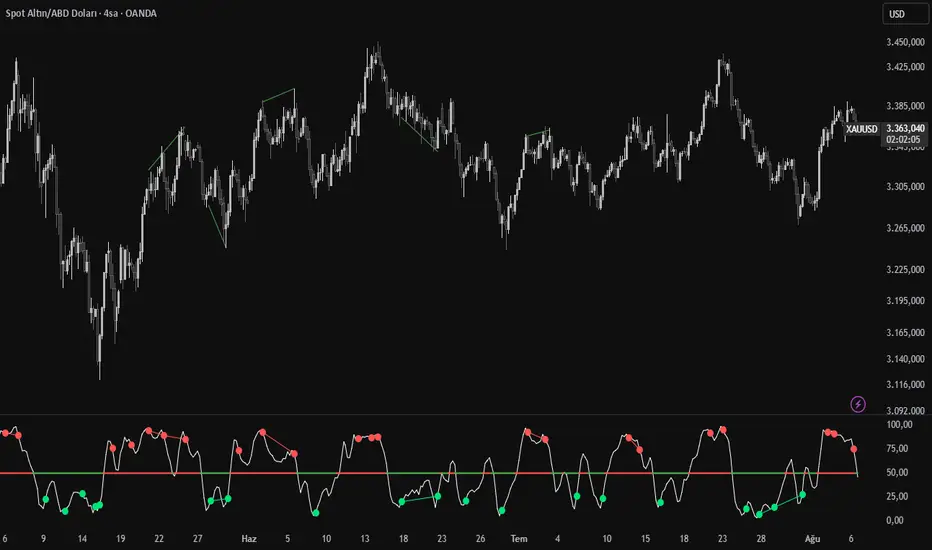
Automatic detection of bullish & bearish divergences
Clear visual signals: red (bearish) and green (bullish) lines
Overbought/oversold zone dots
Price filter option for more reliable divergences
Alerts for reversal and divergence completion
Customizable thresholds and smoothing settings
How to use:
Look for red or green divergence lines for potential trend reversals. Dots in overbought/oversold areas signal possible turning points. Combine with your own analysis for best results.
Note:
This script does not provide buy/sell signals. It is for technical analysis only and is not financial advice. Please use proper risk management.
Protected script. Source code is hidden but free for all TradingView users.
Bullish-divergence
RSI Overbought/Oversold + Divergence IndicatorDESCRIPTION:
This script combines the Relative Strength Index ( RSI ), Moving Average and Divergence indicator to make a better decision when to enter or exit a trade.
- The Moving Average line (MA) has been made hidden by default but enhanced with an RSIMA cloud.
- When the RSI is above the selected MA it turns into green and when the RSI is below the select MA it turns into red.
- When the RSI is moving into the Overbought or Oversold area, some highlighted areas will appear.
- When some divergences or hidden divergences are detected an extra indication will be highlighted.
- When the divergence appear in the Overbought or Oversold area the more weight it give to make a decision.
- The same color pallet has been used as the default candlestick colors so it looks familiar.
HOW TO USE:
The prerequisite is that we have some knowledge about the Elliot Wave Theory, the Fibonacci Retracement and the Fibonacci Extension tools.
Wave 1
(1) When we receive some buy signals we wait until we receive some extra indications.
(2) On the RSI Overbought/Oversold + Divergence Indicator we can see a Bullish Divergence and our RSI is changing from red to green ( RSI is higher then the MA).
(3) If we are getting here into the trade then we need to use a stop loss. We put our stop loss 1 a 2 pips just below the lowest wick. We also invest maximum 50% of the total amount we want to invest.
Wave 2
(4) Now we wait until we see a clear reversal and here we starting to use the Fibonacci Retracement tool. We draw a line from the lowest point of wave(1) till the highest point of wave (1). When we are retraced till the 0.618 fib also called the golden ratio we check again the RSI Overbought/Oversold + Divergence Indicator. When we see a reversal we do our second buy. We set again a stop loss just below the lowest wick (this is the yellow line on the chart). We also move the stop loss we have set in step (3) to this level.
Wave 3
(5) To identify how far the uptrend can go we need to use the Fibonacci Extension tool. We draw a line from the lowest point of wave(1) till the highest point of wave (1) and draw it back to the lowest point of wave (2). Wave (3) is most of the time the longest wave and can go till it has reached the 1.618 or 2.618 fib. On the 1.618 we can take some profit. If we don't want to sell we move our stop loss to the 1 fib line (yellow line on the chart).
(6) We wait until we see a clear reversal on the Overbought/Oversold + Divergence Indicator and sell 33% to 50% of our investment.
Wave 4
(7) Now we wait again until we see a clear reversal and here we starting to use the Fibonacci Retracement tool. We draw a line from the lowest point of wave(2) till the highest point of wave (3). When we are retraced till the 0.618 fib also called the golden ratio we check again the RSI Overbought/Oversold + Divergence Indicator. When we see a reversal we buy again. We set again a stop loss just below the lowest wick (this is the yellow line on the chart).
(8) If we bought at the first reversal ours stop los was triggered (9) and we got out of the trade.
(9) If we did not bought at step (7) because our candle did not hit the 0.618 fib or we got stopped out of the trade we buy again at the reversal.
Wave 5
(10) To identify how far the uptrend can go we need to use the Fibonacci Extension tool. We draw a line from the lowest point of wave(2) till the highest point of wave (3) and draw it back to the lowest point of wave (4). Most of the time wave 5 goes up till it has reached the 1 fib. And that is the point where we got out of the trade with all of our investment. In this trade we got out of the trade a bit earlier. We received the sell signals and got a reversal on the Overbought/Oversold + Divergence Indicator.
We are hoping you learned something so you can make better decisions when to get into or out of a trade.
If you have any question just drop it into the comments below.
FEATURES:
• You can show/hide the RSI .
• You can show/hide the MA.
• You can show/hide the lRSIMA cloud.
• You can show/hide the Stoch RSI cloud.
• You can show/hide and adjust the Overbought and Oversold zones.
• You can show/hide and adjust the Overbought Extended and Oversold Extended zones.
• You can show/hide the Overbought and Oversold highlighted zones.
• Etc...
HOW TO GET ACCESS TO THE SCRIPT:
• Favorite the script and add it to your chart.
REMARKS:
• This advice is NOT financial advice.
• We do not provide personal investment advice and we are not a qualified licensed investment advisor.
• All information found here, including any ideas, opinions, views, predictions, forecasts, commentaries, suggestions, or stock picks, expressed or implied herein, are for informational, entertainment or educational purposes only and should not be construed as personal investment advice.
• We will not and cannot be held liable for any actions you take as a result of anything you read here.
• We only provide this information to help you make a better decision.
• While the information provided is believed to be accurate, it may include errors or inaccuracies.
Good Luck and have fun,
The CryptoSignalScanner Team

Jae Flow+Jae_Folw+
- Auxiliary indicator that can judge the overall flow / short-term flow of the market
- Flow Chart is divided into upper / middle / lower part
- There is no timeframe limitation, but like the existing divergence trading, we recommend trading by specifying the mainframe.
🔋 (green line) : It is written with an algorithm based on (5 33 / 10 66 / 20 1212) "3 Stochastic", and is used to check the double peak/double bottom easly.
➕ (Cross): Reports Gold Cross/Dead Cross of existing (5 33 / 10 66 / 20 1212) "3 Stochastic".
🔷 (diamond): It is written with a DCP-based(MA+Volume Trend) algorithm to indicate the turning point of the trend
🌈 Basics of trading 🌈
Reversal of Trend Requires Diver/Finale
A chart with a large trading volume cannot go in the opposite direction.
To relieve the moving inertia, after the beam is finished, the beam is crossed and the wave is drawn (during this sidewalk, a divers of an appropriate size is generated)
Indicators to help you know when and where this inertia will end
Trade with the idea that the downward ball changes its inclination and catches the flow in the opposite direction.
It takes longer than I thought for the ball to stop and move in the opposite direction.
🌈🌈
====Usage====
====Basically recommend using divergence as a base, judging the flow of wave (market) with Jaeflow====
📍0. Identifying mainframes and specifying frames to buy and sell
📍1. "Top Flow"
A Need to check the double ceiling/double bottom of the green line of “top flow” (think of the green line as RSI and check the divergence with the candle BEST)
B Cross signal from double ceiling/double floor = flow is changing
C Does a diamond occur at this time + what is the shape of the lower "interrupted flow" (overbought/overbought? double floor/ceiling? etc.)
D Rather than trading with “upper flow”, it is better to see the upper flow following the stop flow
📍2. "Middle Flow"
A Use the same as above
B "Middle flow" consists of the strongest signal to judge the flow
C Active participation in trading if the “Top flow” double peak + stop flow double bar + cross signal + diamond signal continues
📍3. "bottom flow"
A When the above trading conditions are established, check whether the "bottom flow" is also the form immediately preceding the desired shape (BEST)
B If you can see the double-floor/double-ceiling shape in "Bottom Flow", it is recommended to increase the time frame by one level (there is a possibility that it is not the main frame)
📍4. "2 diamonds" or "3 diamonds"
A If “upper/middle/lower flows” occur at the same time, it can be seen as a signal of a strong trend reversal.
🥇 "When Diver Occurs" 🥇
Use it to overlap with items 1,2,3,4 above to judge the trend
===============================================================================================
🥇 Jaedie 사용자를 위한 JaeFlow
- 시장의 전체 흐름 / 단기 흐름을 판단할 수 있는 보조지표
- Flow Chart는 상단 / 중단 / 하단부 로 나뉜다
- 타임프레임의 제한은 없지만, 기존 다이버전스 매매와 같이 메인프레임을 특정하여 매매를 추천
🔋 (녹색선) : (5 33 / 10 66 / 20 1212) 3스토 기반의 알고리즘으로 작성되어, 쌍봉/쌍바닥을 확인하는데 쓰임
➕(크로스) : 기존 (5 33 / 10 66 / 20 1212) 3스토의 골드크로스/데드크로스를 알려줌
🔷(다이아) : DCP기반의 알고리즘으로 작성되어 추세의 전환점을 나타냄
🌈매매의 기본에 대하여🌈
추세의 전환에는 다이버/피날레가 필요함
큰 거래량의 빔형태의 차트가 바로 반대방향으로 갈수는 없음
움직이던 관성을 해소하기 위해 빔이 끝난 후 횡보를 하며 파동을 그림 (이 횡보 도중 적당한 크기의 다이버가 발생하게 되고)
이 관성이 끝날 타이밍과 흐름(Flow)을 알 수 있도록 도와주는 지표
내려가던 공이 기울기가 바뀌어 반대방향으로 굴러가는 흐름을 잡는다는 생각을 하며 매매를 수행
이 공이 멈춰가며 반대방향으로 움직이기엔 내 생각보다 더 긴 시간이 필요함
🌈🌈
====사용법====
====기본적으로 Jaedie의 다이버전스를 Base로 활용 추천, Jaeflow로 파동(시장)의 흐름을 판단====
📍0. 메인프레임 특정 및 매매할 프레임 특정하기
📍1. "상단 플로우"
A "상단 플로우"의 녹색 선 쌍천장/쌍바닥을 확인해야 함 (녹색 선을 RSI라 생각하고 캔들과의 다이버전스를 확인 BEST)
B 쌍천장/쌍바닥에서 나오는 크로스 신호 = 흐름이 변하고 있다
C 이때 다이아가 발생하는지 + 아래쪽 "중단 플로우"의 형태는 어떠한지 (과매수/도 인지? 쌍바닥/천장 인지? 등)
D "상단 플로우"로 매매를 수행하기보단 상단 플로우가 중단 플로우와 이어지는 형태를 보는게 좋음
📍2. "중단 플로우"
A 위와 마찬가지로 활용
B "중단 플로우"는 흐름을 판단하기에 가장 강력한 신호로 이루어져 있음
C "상단 플로우"의 쌍봉 + 중단플로우의 쌍봉 + 크로스 신호 + 다이아 신호등이 이어진다면 매매에 적극적으로 참여
📍3. "하단 플로우"
A 위의 매매조건이 성립했을때, "하단 플로우" 또한 원하는 모양의 바로 직전형태인지 확인(BEST)
B "하단 플로우"에서 대놓고 쌍바닥/쌍천장의 형태가 보인다면 타임프레임을 한단계 높이는걸 추천 (메인프레임이 아닐 확률이 있음)
📍4. "2다이아" or "3다이아"
A "상/중/하단 플로우"가 동시에 다이아가 발생하는 경우 강한 추세전환의 신호로 볼 수있음
🥇 "Jaedie 다이버 발생 시" 🥇
위의 1,2,3,4 항목들과 중첩하여 사용하여 추세를 판단
캔들이 빔을 쏘는 도중 or 관성이 끝나지 않은 도중 반대포지션 진입을 자제합시다
충분히 유연한 곡선으로 그려질 경우 + 다이버가 추가 될 경우 포지션 진입을 하는 매매습관을 들입시다

AMACD - All Moving Average Convergence DivergenceThis indicator displays the Moving Average Convergane and Divergence ( MACD ) of individually configured Fast, Slow and Signal Moving Averages. Buy and sell alerts can be set based on moving average crossovers, consecutive convergence/divergence of the moving averages, and directional changes in the histogram moving averages.
The Fast, Slow and Signal Moving Averages can be set to:
Exponential Moving Average ( EMA )
Volume-Weighted Moving Average ( VWMA )
Simple Moving Average ( SMA )
Weighted Moving Average ( WMA )
Hull Moving Average ( HMA )
Exponentially Weighted Moving Average (RMA) ( SMMA )
Symmetrically Weighted Moving Average ( SWMA )
Arnaud Legoux Moving Average ( ALMA )
Double EMA ( DEMA )
Double SMA (DSMA)
Double WMA (DWMA)
Double RMA ( DRMA )
Triple EMA ( TEMA )
Triple SMA (TSMA)
Triple WMA (TWMA)
Triple RMA (TRMA)
Linear regression curve Moving Average ( LSMA )
Variable Index Dynamic Average ( VIDYA )
Fractal Adaptive Moving Average ( FRAMA )
If you have a strategy that can buy based on External Indicators use 'Backtest Signal' which returns a 1 for a Buy and a 2 for a sell.
'Backtest Signal' is plotted to display.none, so change the Style Settings for the chart if you need to see it for testing.

4x Stochastic Dingue4 Stochastic indicator into 1.
Different lengths produce short-term and long-term indicators that can help with finding the trend and impulses within the trend.
It can also find reversal points when all 4 are at the extreme at the same time. Ex. All 4 Stoch are above 90 or under 10 !! This could signal a bottom or top is soon to happen. (This is not always true as it depends on many factors.)
Many visual options make it even more customizable. Fill between Stoch, background colors, Crosses.
Divergences are not always accurate, depending on settings and timeframe, but they can be useful in certain situations.
---------------------
In closing, no indicator can give perfect signals, you need to use them in conjunction with other information to make better decisions.
I hope you like my indicators and that they help your trading.
If you have any questions please ask.
Thank you.

[astropark] Bullish Bearish Divergences for all OscillatorsDear Followers,
today a new great Scalper Tool , which works excellent on all timeframes and charts , both FOREX and Cryptocurrencies!
It alerts you when a new divergence has been spotted on the chart based on your preferred oscillator or set of oscillators ( yes, you can combine them! )
Here the list of currently supported oscillators (more in the future):
RSI (Relative Strength Index)
MACD
MACD Histogram
Stochastic
Stochastic RSI
CCI (Commodity Channel Index)
Momentum
Volume Oscillator
OBV (On Balance Volume)
VWmacd
Bollinger Bands %B
William %R
Chaikin Money Flow
Chaikin Oscillator
AO (Awesome Oscillator)
DPO (Detrended Price Oscillator)
Ultimate Oscillator
RVI (Relative Volatility Index)
Klinger Oscillator
This script will let you set all notifications you may need in order to be alerted on each triggered divergence (both regular and hidden).
This script:
works on all timeframes , starting from 1 minute: so you can enjoy high-frequency trading by using a 24/7 running bot and a proper money and risk management strategy if you like
shows you both bullish and bearish divergences, both regular and hidden , with a triangle up or down respectively
lets you activate more than one oscillator at the same time
lets you choose to be alerted only if all active oscillators agree on spotted divergence , so you will get only stronger and more secure ones (you can set both all or at least a configurable number of enabled oscillators)
lets you edit basic configuration settings of each oscillator
lets you disable or enable hidden divergences on chart
This is a premium indicator , so send me a private message in order to get access to this script.

BOSS Smooth Stochastic-RSI And RSI Oscillators With Alerts THE BEST FOREX, BINARY OPTIONS, STOCK AND CRYPTO INDICATORS FOR TRADINGVIEW.COM
Our Smooth Stochastic RSI indicator and our RSI indicator all combined in one!
BACKGROUND AND BAR COLOR
Green=BULLISH
Yellow= NEUTRAL/TRANSITIONAL
Red= BEARISH
ALERTS
GET ALERTS FOR BULLISH AND BEARISH CROSSOVERS ON STOCHASTIC RSI
GET ALERTS WHEN RSI LINE IS GREEN AND RED

08-2018 Stochastic 5m [ALERT SETUP] [INDICATOR]This is an accumulation of small buy orders and a complete sell order strategy, that can be used for manual trading or for a trading bot. The strategy is based on stockastic divergences ( an indicator that I made myself and is published on my profile earlier ), and I added my personnal touch of course. Note that the bullish and bearish stochastic divergences are calculated separately and can be configured in the inputs.
To be used with a 5m timeframe, and on a flat or bullish pair.
Everyone can favorite the script, apply it to the chart, but only I can see or modify the code. If you need anything, leave a comment, thanks :D
More info about the script, such as inputs description, how to configure the script, strategy explanation, alert configuration can be found here : blockchainfiesta.com
--------------------------------------------------------------------------------------------------------------
I do commission work: TradingView Pine Script development & Reverse Engineering.
contact@blockchainfiesta.com.
You can also send me a message in TradingView or Discord (discord.gg)
Bitcoin address: 19sVQvCDmVfEACq7BiMnWSMqFPZ8qfSQ2K
ETH address: 0xc8a5d3a63a05db0c2363ea1c08b37a01cce9ebfb

Stochastique Divergences IndicatorHello,
I made a custom indicator.
Divergences with stochastique and price are really strong signals.
About the indicator
A bullish divergence happens when the stoch K makes a higher low and is depicted by a green triangle up.
A bearish divergence happens when the stoch K makes a lower high and is depicted by a red triangle down.
This script is the base for my next strategy that I should upload soon.
I will grant access (to this script and my others) to people willing to make a small donation.
Here is my BTC address : 19sVQvCDmVfEACq7BiMnWSMqFPZ8qfSQ2K
If you prefer ETH : 0xc8a5d3a63a05db0c2363ea1c08b37a01cce9ebfb
Send me a Private Message with the ID of the transaction
If you want to do some forward testing first, send me a message.
Also check blockchainfiesta.com
