PpSignal quantiles BandIn statistics and the theory of probability, quantiles are cutpoints dividing the range of a probability distribution into contiguous intervals with equal probabilities, or dividing the observations in a sample in the same way. There is one less quantile than the number of groups created. Thus quartiles are the three cut points that will divide a dataset into four equal-size groups (cf. depicted example). Common quantiles have special names: for instance quartile, decile (creating 10 groups: see below for more). The groups created are termed halves, thirds, quarters, etc., though sometimes the terms for the quantile are used for the groups created, rather than for the cut points. q-Quantiles are values that partition a finite set of values into q subsets of (nearly) equal sizes. There are q − 1 of the q-quantiles, one for each integer k satisfying 0 < k < q. In some cases the value of a quantile may not be uniquely determined, as can be the case for the median (2-quantile) of a uniform probability distribution on a set of even size. Quantiles can also be applied to continuous distributions, providing a way to generalize rank statistics to continuous variables. When the cumulative distribution function of a random variable is known, the q-quantiles are the application of the quantile function (the inverse function of the cumulative distribution function) to the values {1/q, 2/q, …, (q − 1)/q}
BTCUSD

weekend rally bloody mondayTracks the gain-loss of the price on Mondays and the range gain-loss from Monday (configurable) to Sunday. Then, it identifies Sunday's pumps that end with a Monday dump.

PpSignal Stoch Jake Bernstein , Aroon, Ewo and T3 Velocityfour indicator in one, You can choice in option Stochastic Jake Bernstein Method, Aroon, Ewo or T3 Velocity

Slices of Bitcoin
A very simple indicator that shows how many times a currency fits into Bitcoin. In other words, the higher the value, the weaker the currency against Bitcoin.
You can easily see that since the beginning of 2019 Stellar Lumen (XLM) lost half of its BTC-value while the USD-value was constant.

Pump Finder v1.0Generally speaking, when a big pump occurs one can expect the price to trend upward.
This script is by default well suited for timeframes larger than 15m. Use on smaller timeframes at your own risk.
When combined with basic TA like trendlines, support and resistance this can be a very powerful indicator.
This indicator performs well for the larger volume crypto's like BTC, BNB, ETH etc. See snapshots below.
Be aware:
- After multiple pumps, the chance of trend reversal becomes more likely.
- False breakouts.
- Always do your own research.
If you have any suggestions, feel free to let me know.

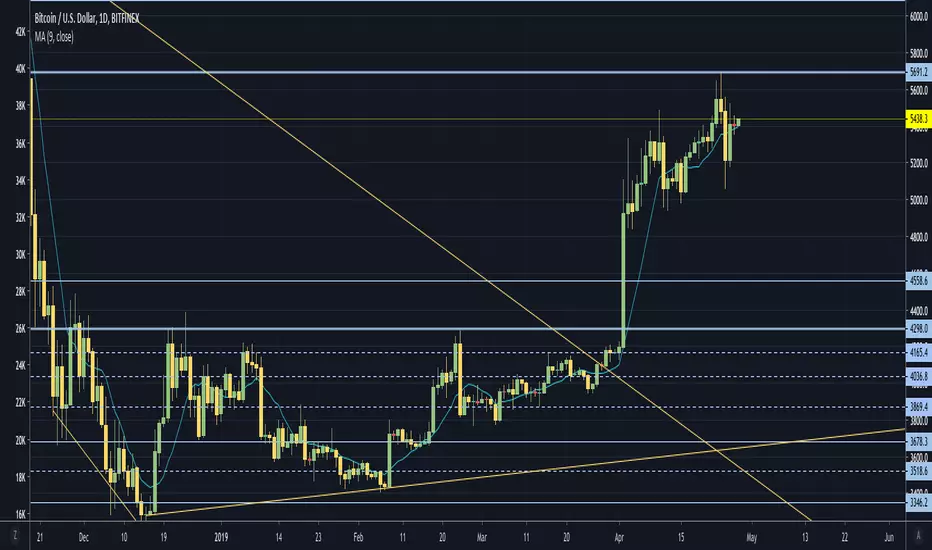
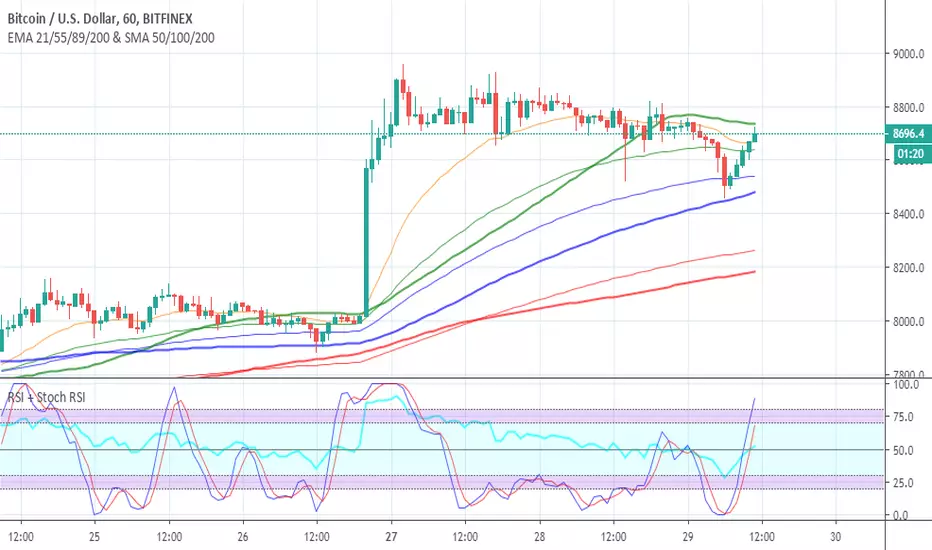
EMA 21/55/89/200 & SMA 50/100/200Free to use indicator combining all important time periods for two of the most valuable trading tools: EMAs and SMAs . As you can see on the chart and previous time periods, BTC often bounces off these, giving you an insight into possible future price movement. Add to your favourite scripts now at the bottom of this page and stay ahead of the game.
Switching off all except the most important periods in the indicator settings (21 & 55 EMA + 100 & 200 MA) can help keep a nice clean trading chart, if that is your preference.
SIMPLE MOVING AVERAGE
Smooths out the price across each period to reveal short, medium and long term trends and potential areas of support or resistance.
50, 100 and 200 are three of the most commonly used/respected moving averages.
The 200MA in particular provides very strong support/resistance on longer time frames.
EXPONENTIAL MOVING AVERAGE
A slightly more sophisticated version of the moving average, the EMA gives more weight to recent price action (i.e. a recent big move up/down will be reflection sooner... "the trend is your friend").
21, 55, 89 and 200 are four of the most commonly used/respected exponential moving averages.
The 21 and 55 EMA are undoubtedly the most powerful, and somewhat a self-fulfilling prophecy since so many people follow them.
Just so you know...
Green = 55/50, blue = 89/100, red = 200/200
EMAs are shown with thinner lines (as they change direction faster, think light and quick)
SMAs are shown with thicker lines (as they change direction slower, think heavier and more respected)
My free Combined RSI and Stochastic RSI Indicator , is also shown on the chart above and will save you valuable space on your trading screen, since you are strictly limited to the number of indicators you can use at one time. Give it a try and you'll wonder why you ever had separate indicators for RSI and Stoch RSI clogging up both your screen and indicator allowance.
These tools are for educational purposes only and not a recommendation to buy or sell. Always do your own research before trading.
PpSignal twiggs_money_flowTwiggs Money Flow is my own derivation, based on the popular Chaikin Money Flow indicator, which is in turn derived from the Accumulation Distribution line. We are all indebted to Marc Chaikin and Larry Williams for the contribution they have made to the field of technical analysis and price-volume oscillators.
for more information visite: www.incrediblecharts.com

Scalp TraderA nice strategie for the beginners traders..in order to help see better how to folllow the trend.. because trend is youre friend :)
For access ----> private message.

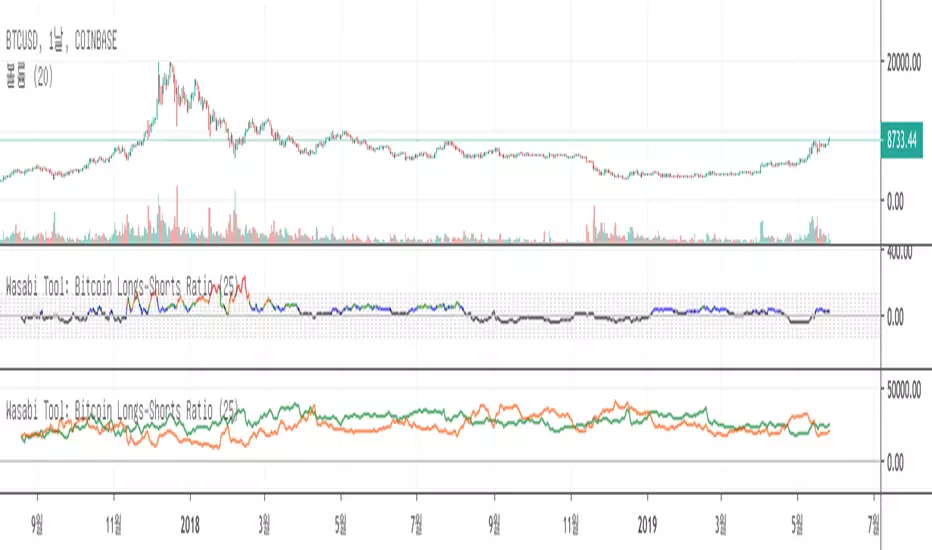
Wasabi Tool: Bitcoin Longs-Shorts Ratio
This indicator is to show how much more Bitcoin Longs exist in comparison to Bitcoin Shorts in percent.
It is calculated as * 100 (%)
By default, the indicator displays the Longs-Shorts ratio. You can also show the actual Bitcoin Longs and Shorts numbers instead by disabling 'Show Longs-Shorts Ratio' in the settings. In this case, the Longs are in green and the Shorts are in red.
The data is coming from Bitfinex exchange.
This indicator can be used for free . Please subscribe and Like it.
현 지표는 비트코인 숏 물량대비 롱 물량이 얼마나 많은지를 퍼센티지(%)로 표현하는 지표 입니다.
계산식은 (Bitcoin Longs - Bitcoin Shorts) / Bitcoin Shorts ] * 100 (%) 입니다.
기본 표시값은 롱-숏 비율이지만, 설정에서 비율이외에도 'Show Longs-Shorts Ratio' 를 비활성화하면 비트코인 롱 과 숏 실제 수치 표시를 할 수 있습니다.
이 경우, 초록선은 롱 물량이고, 빨간선은 숏 물량입니다.
자료는 Bitfinex 거래소 자료 입니다.
이 지표는 무료로 사용 가능 합니다. 팔로우+좋아요 부탁 합니다~
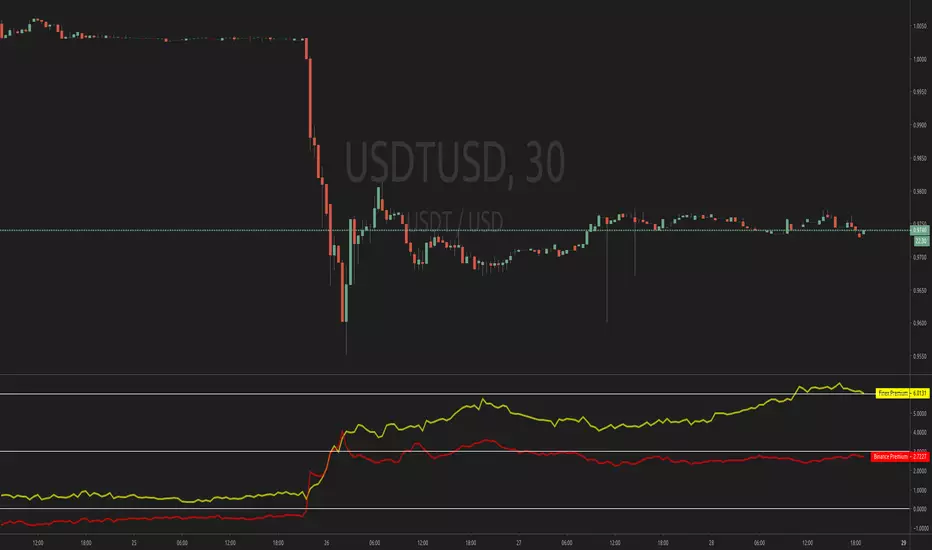
Wasabi Tool: GBTC Premium IndicatorWasabi Tool: GBTC Premium Indicator
I'd like to introduce my new indicator, which is called 'Wasabi Tool: GBTC Premium Indicator' .
This indicator is to show the premium of the well-known Grayscale's Bitcoin Trust, GBTC in percent(%) .
It's been widely known that people can invest in Bitcoin via GBTC in their regular brokerage accounts and even in their Brokerage-linked 401k accounts. Yes, for those of people with their pension accounts, they have been able to invest in Bitcoin indirectly (eg. Fidelity's Brokerage-linked 401k) and to take advantage of the volatile price actions.
With the volatile nature of Bitcoin, the GBTC normally follows the exact price action, up or down, of Bitcoin. However, some exuberant interest in the investors and the limited supply of GBTC make GBC's price go much higher than its NAV(Net Asset Value) price per share, which is the amount of bitcoin per share of 0.00098247 BTC, also found at the Grayscale website, at the time of writing.
Until Bitcoin ETF becomes a reality, GBTC is a practical and viable option for 401k investors to invest in Bitcoin as of now.
You may find it useful to compare this indicator along with the Bitcoin trends found in Internet. The difference is that this indicator is to show the ACTUAL exuberance and eagerness by those of people who have restrictions in investing directly in Bitcoin for whatever reasons.
I hope you like the indicator.
Please subscribe and Like it.
Thanks,
Wasabi
---
안녕하세요. 와사비 입니다.
오늘 새로 만든 지표는 'Wasabi Tool: GBTC Premium Indicator' 입니다.
이 지표는 그 레이스케일 투자 회사의 트러스트 상품인 GBTC 가 실제 가치(NAV)대비 얼마나 프리미엄이 붙어 있는지를 표시하는 지표 입니다.
널리 알려졌다시피, 미국에서는 일반인들도 일반 증권회사나 심지어 401K라는 연금계정에서도 GBTC 트러스트 상품 투자를 통해 비트코인에 간접적으로 투자를 할 수 있습니다.
비트코인의 심한 가격변동과 마찬가지로, GBTC도 비트코인의 가격을 쫓아갑니다. 하지만, 투자자들의 열광적인 투자관심과 GBTC의 부족한 공급물량으로 인해 GBTC의 가격이 NAV (글 쓰는 현재 기준 1 GBTC = 0.00098247 BTC )로 표현되는 실제 가치보다 훨씬 많은 프리미엄(때론, 100%이상)을 내고 거래되어 오고 있는 실정입니다.
향후 Bitcoin ETF가 현실이 될 때까지는, GBTC상품이 401K 연금 투자자들에게는 현재 비트코인에 투자할 수 있는 현실적인 옵션입니다.
이 지표를 잘 보시면, 지난 2017년도에도 여러번 실제 가치보다 100% 이상 넘는 가격 프리미엄을 보인 것을 알 수 있습니다.
구글 트렌드가 사람들이 인터넷에 비트코인을 언급하는 구매와 직접 관련없는 관심레벨을 이야기 한다고 하면,
이 프리미엄 지표를 통하면 비트코인에 직접 투자하지 못하는 일반 주식 투자자나 연금 투자자들이 얼마나 높은 프리미엄을 내면서까지 투자하는지에 대한 실제 '광풍정도'를 가늠해 볼 수 있습니다.
도움이 되셨다면 구독+좋아요 부탁드립니다.
와사비 드림.

PpSignal Random Walk Monte Carlo MethodRandom Walk Utility
The random walk generator allows users of the Monte Carlo to further understand how the Monte Carlo projection is generated by creating a visual representation of individual random walks. Trends that occur on the random walks may correlate to the historical price action of the underlying security.
Understanding the Random Walk Simulation
This indicator randomly generates alternative price outcomes derived from the price movements of the underlying security. Monte Carlo methods rely on repeated random sampling to create a data set that has the same characteristics as the sample source, representing examples of alternate outcomes. The data set created using random sampling is called a “random walk”.
First, every bar in the time stamp is measured logarithmically and put into a population.
Then, a sample is drawn at random from the population and is used to determine the next price movement of the random walk. This process is repeated fifteen times to visualize whether the alternative outcomes lie above or beneath the current market price of the security.

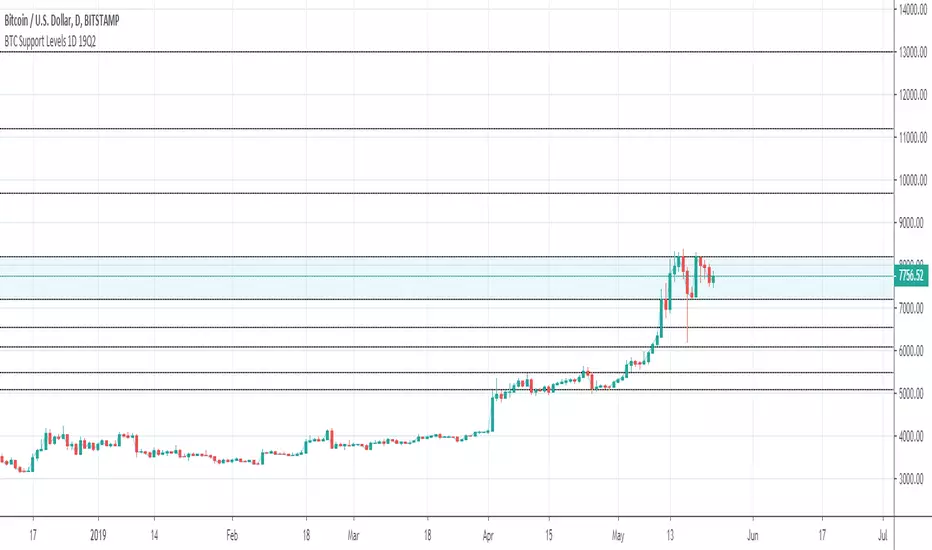
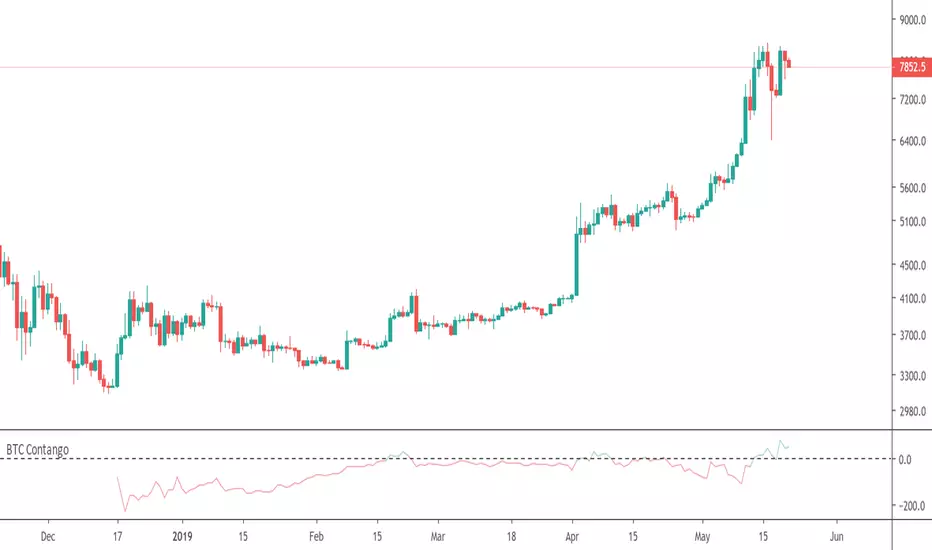
BTC Contango indicatorThis is a Bitcoin contango indicator, which tells you the difference in price between the price of the specified BTC futures contract and the current spot price. A viable strategy is to sell when "contango" occurs, which means the futures price is greater than the spot price (green line, above 0), and buy when it is below.
If you found this indicator useful, please feel free to tip so that I can continue making more free indicators!
BTC: 1JkcVwaPZfvpqxGio4iz2aENa2gj8oowxi
ETH: 0x71d509eeb9f86296c3f55bb7e882d9e69e393b2a
EOS: 0x71d509eeb9f86296c3f55bb7e882d9e69e393b2a
Momentum Signal Moving AverageThis is a script with one modified indicator that mainly tracks and executes positions openings by calculating volume and "enthusiasm" from the exchanges coin pairs. I recommend that it is used on a 15m chart.
When it is a bullish trend it is configured to take profit, but this is of course something you can set values or disable. In bearish trends, the script opens bigger positions, and when a bounce happens the script starts taking profit.
In stagnation, the script used to be week, and made losses. However, with the added scalping feature it seems to at least even it out, or even make profit as I have seen now.
It's still a very 1.0 script and will get updated to make sure the profit keeps getting higher percentage.
I use the Alerts Trader extension to execute orders from Tradingview in Chrome via Bitmex API.
I use it on Bitmex, but surely you can use it on other exchanges that are supported in the Alerts Trader extension, which is extensive.
Important : You will be able to add this script to your chart, but you won't be able to se the source code, so to make it work you need to set the alerts right, with correct code for it to work.
Here is where I come in:
I'll give each user 3 day trial, and after that, if you are satisfied and want to run it longer, you can subscribe for $49/month.
And if you have bigger capital, I will install it and configure it to match the amount of contracts you wish to have.
If you are a person with big capital, you can get 1 week of trial.
And for people with big capital, you can get personal support from me when needed to alter settings or create new alerts. This will cost $50 each time.
But remember, you can also run the trial on the Bitmex testnet, but the volume is very low there so the bot does not preform as well on the testnet as it does on the mainet with big volume.
I am willing to let someone, a 3rd party, with good reputation test it for a few days and make an honest review after.
Disclaimer: I cannot guarantee that this script will make you rich, but after a week of testing, both on testnet and mainnet, the results are good enough for me. (I am no financial expert or professional trader. Any losses from the algorithm is not my issue, use it at your own risk. Always run the script/bot with money you can afford to lose)
All payments to me are made in bitcoin.

Crypto Indicators #u9tusA set of low timeframe (LTF), medium timeframe (MTF), and high timeframe (HTF) indicators for use in crypto currencies / bitcoin.
Traditionally the 10, 20, 50, 100, and 200 SMAs are used in TA. With cryptos, I've found that the 8 EMA, 21, 55, and 128 SMAs backtest better, while no change in length was necessary for the 200. I wanted to combine all these into one indicator to easily add them to a chart layout, hence this script.
You can customize the length of each MA to your liking in the settings, or accept the defaults.
LTF Indicators:
8 EMA in blue hues, medium line stroke.
MTF Indicators:
21, 55 SMA in purple hues, medium line stroke.
HTF Indicators:
128, 200 SMA in yellow hues, thick line stroke.
Defaults are for daily timeframes and lower; suggest changing up the intervals for weekly and monthly to:
21 -> 30
55 -> 50
128 -> 100
$BTC, $ETH, #ALTS
twitter.com
(c) @jhaurawachsman 20190515

Wasabi BuySell Indicator (aka. Jeon-Nah-Goo BuySell)Wasabi BuySell Indicator (aka. Jeon-Nah-Goo BuySell)
Hello, everybody!
This is Wasabi.
I have lifted the restriction of 3-week no-display mode in this version.
Therefore, this will only be selectively relesed to some invited people who have requested for the indicator via the request form found either in my Status section or at the end of the page.
This indicator is
1) to show buy signals in a downward divergence of two moving averages
i) when the faster moving average crosses under the slower moving average
ii) and at same time when the bar crosses under the faster moving average
2) and to show sell signals in an upward divergence of two moving averages
i) when the faster moving average crosses above the slower moving average
ii) and at same time when the bar crosses above the faster moving average
As of now, the default factor values set in the settings have been designed for BTCUSD market(Bitstamp exchange)'s weekly chart.
You will have to find and change the factor values for other market or crypto currencies.
You can specify the following factors in the settings:
- The number of periods for the slower moving average(MA)
- The number of periods for the faster moving average(MA)
- The coefficient factor of the faster MA to the slower MA for Buy signal
- The coefficient factor of the faster MA to the slower MA for Sell signal
- The multiples of the last All Time High for Village-saving person(aka. Jeon-Mah-Goo)
- The multiples of the last All Time High for Country-saving person(aka. Jeon-Nah-Goo)
Hope you have all great trading!
현 보조지표 "Wasabi BuySell Indicator (aka. Jeon-Nah-Goo 전.나.구. BuySell)" 는 장/단기 이평선이 과도한 역배열일때 매수신호를, 과도한 정배열일 때 매도신호를 내고,
설정에서 입력한 장/단기이평선 비율계수에 의해 과도한 정도를 계산하여 매수/매도신호를 내도록하는 보조 지표입니다.
현 보조지표는 3주 표시잠금 해제된 실시간용입니다.
현재 기본 설정값은 비트스템프 거래소 비트코인 주봉차트에 대한 설정값입니다.
각 암호화폐마다 맞는 설정값은 제가 올린 다른 각 암호화폐 적용한 <아이디어>를 참고해서 설정값 적용 예를 보시기 바랍니다.
<설정>에서 각 암호화폐/주식/상품등에 맞는 설정값을 수정 입력할 수 있습니다.

BTC-WEEKEND GRAVITY Indicator @COINOBS - Hello Fam,
Coin Observatory, back with another indicator.
We call this one the:
Weekend GRAVITY indicator!
That's right,
How to use this indicator:
-ONLY APPLICABLE FOR WEEKEND PRICE ACTION:
-If BTC is trading above our GRAVITY indicator, low leverage shorts, until price returns to gravity line.
-If BTC is trading below our GRAVITY indicator, low leverage longs, until price returns to gravity line.
ONLY USE THIS FOR WEEKEND PRICE ACTION.
Please backtest for us, this indicator has had a 99% accuracy rate for weekend price action.
Want this indicator?
-Just request access! We'll hook you up ;)
-Jump in our discord, link in my bio
At the time of publishing, XBT is trading at 6885
Gravity Indicator tells us, target is 6290

Smoothed RWI(Random Walk Index)Smoothed Random Walk Index.
It gives slightly slower but less false signal than stochastic.
If it draws double bottom with higher low, long entry is considered.
If it draws double with lower high, short entry is considered.
For more accuracy, another smoothed RWI with slower setting is needed.
If fast setting RWI draws lower high AND slower setting RWI is also going down(red color),
short entry is considered with more confidence.

PpSignal SlopeSlope measures the rise-over-run of a linear regression. In general, an uptrend is present when Slope is positive and a downtrend exists when the slope is negative. The timeframe depends on the number of days. ... As with moving averages, Slope can be used with momentum indicators to participate in an ongoing trend.
We did a smooth slope eldher version...

2019- BITCOIN - BTFD -BANDS-60minAs long as BTC is in this uptrend,
We have identified the BTFD bands.
They are on the chart and part of this indicator.
When the Dip happens, turn on this indicator,
Use it on the hourly chart.
BTFD will appear when price is rejected by our BTFD Band.
This strategy indicator has worked since the beginning of BTC bullish turn in February
This indicator is set to expire in December 2019
ONCE BTC closes below our Green line on the hourly, this strategy can be deemed DEAD!
Thanks, BTFD Safely
Like this indicator?
Join our Discord, link in my Bio!

Market God v6Advance your trading game by applying our TA based indicator-study on your charts. Market God v6 is a tool that can be added to any chart, timeframe, or ticker on https://tradingview.com, and suggests the situation at hand as an opportunity to buy or sell you interests.
Market God v6 Product Description
Advance and Improve your understanding of price movement using the Market God v6 Trading Study (accessed via tradingview.com)
* Set alerts to be delivered via email or SMS (See TradingView.com for limitations that may apply, based on your Tradingview account type)
* Quickly identify market trends with visual buy/sell alerts on chart
* Access charts on-the-go via Tradingview mobile app
* Apply study to any symbol within the entire Tradingview library
* Use on any timeframe available to you on Tradingview
Through use of tradingview.com’s advanced Pine Script programming language, I have spent thousands of hours to find the rights combination that has resulted in the indicator study you see today. That said, it is imperative to understand that this study is not a guarantee profit & should be far from the only reason you enter a trade. It is highly recommended that you backtest, or paper trade before using this study, as it is intended to be a tool, and not the end-all-be-all.
When starting, my goal was clear: to create a study that could suggest consistent, reliable, and accurate trades, at a rate of success that was either equal to, or better than if I were doing it myself. Ideally, I figured that if I could take my own personal buy/sell criteria, standardize it, and create an system that informed me once my own criteria was met, it would allow me to succeed on a more consistent basis, and allow me to focus on other projects.
But lets pull it back to way before this indicator was even on the map – to the middle of 2018, specifically the middle of crypto-winter. Like many, I started by doing something I believe every trader or investor should do: writing down the exact criteria that I would ultimately require that I hold myself, in order to enter or exit a position. I then demanded that I abide by that criteria when making any decision in trading. This was relatively easy, and also forced me to really understand where I went wrong, each time I would losing trade.
While establishing the trade plan, I ran through every study/indicator I used personally already, and utilized online resources to understand what made those indicators give the readings they do, and the various ways price movement and volume can be used to calculate trends.
By taking the wealth of knowledge available online, we have successfully created a study that applies these methods of TA, and standardizes a system of trading that was successfully established in the bear market.

Finex PremiumThis is a simple script for the Bitfinex premium against Bitstamp
Easy to modify values