Indikator-Indikator Rentang


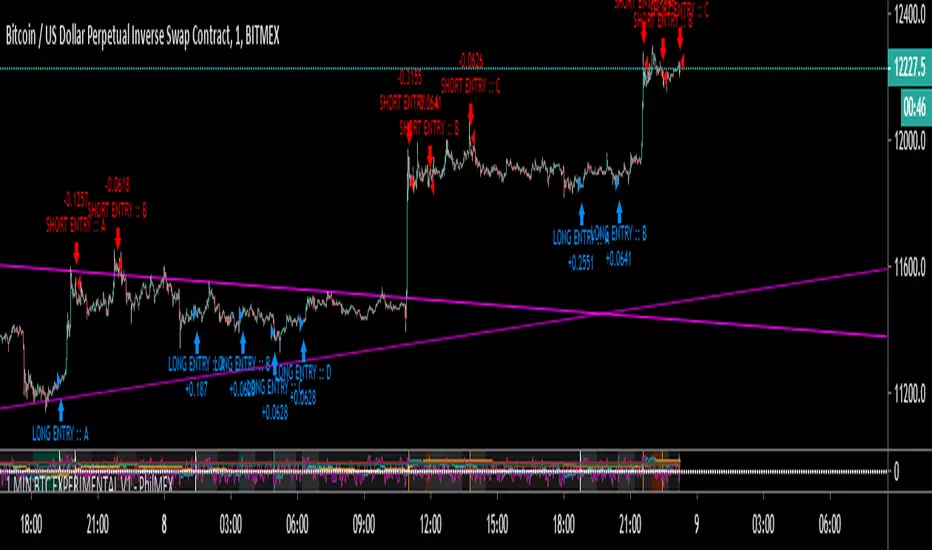
1 MIN BTC EXPERIMENTAL V1 - PhilMEXThis script is intented to work only on 1 minute chart.
It gives very clear signals for buy or sell and has no repainting.
Unfortunatelly I can only test it with the 7 last day due to limit for backtesting.
Do you know guys how can I extend this backtesting time period?
Please use it very carrefully. I'm not responsible for your loss.
If you want updates or more indicators like this one please give me a thumbs up ;)
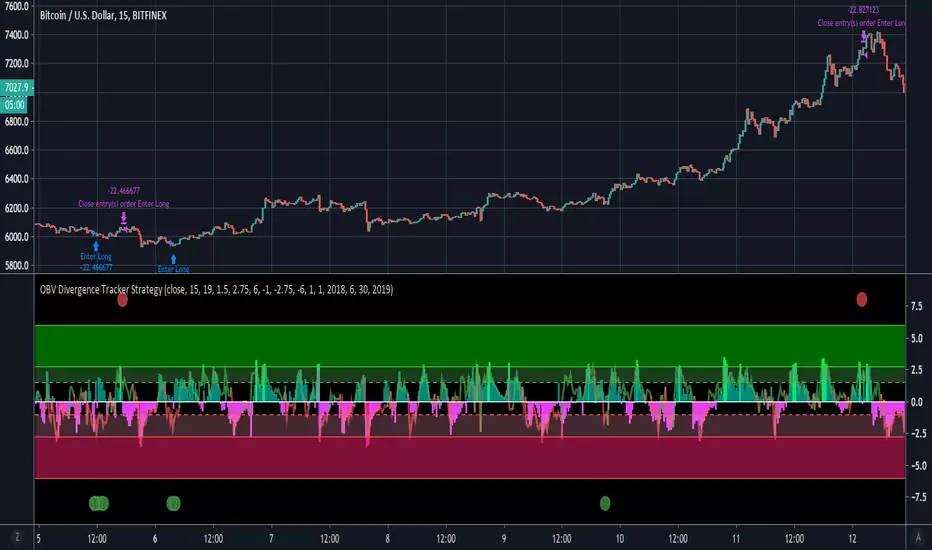
OBV Divergence Tracker StrategyThis strategy combines OBV Z Scores and price Z Scores to identify divergences and generate entry and exit signals.
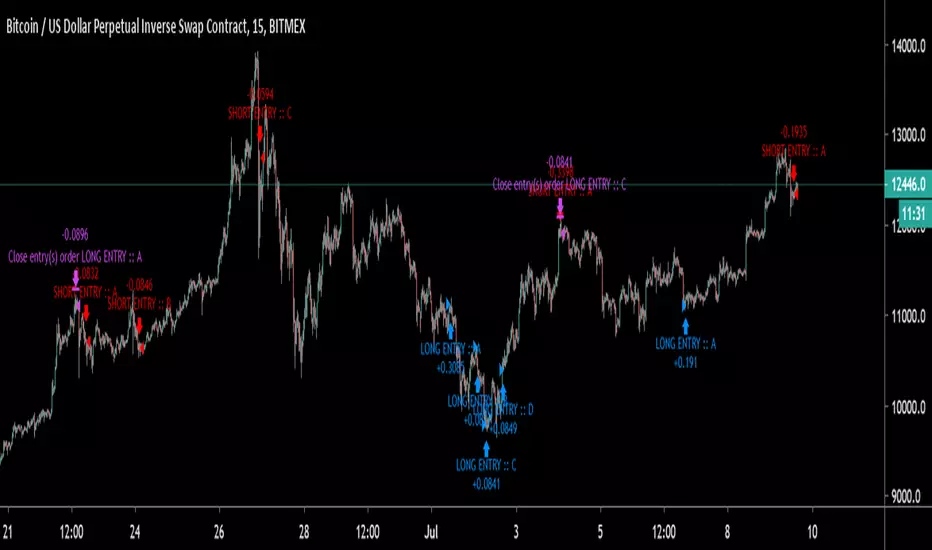
BTC crypto bot indicator 3 MIN - PhilMEXBTC Crypto bot indicator
Can be used on all BTC USD / XBT USD
Must be used on 3 minutes timeframe only
Signals are pretty accurate and this code has no repaint.
Hope this help for your trading and Bitmex.
Some updates may come soon.

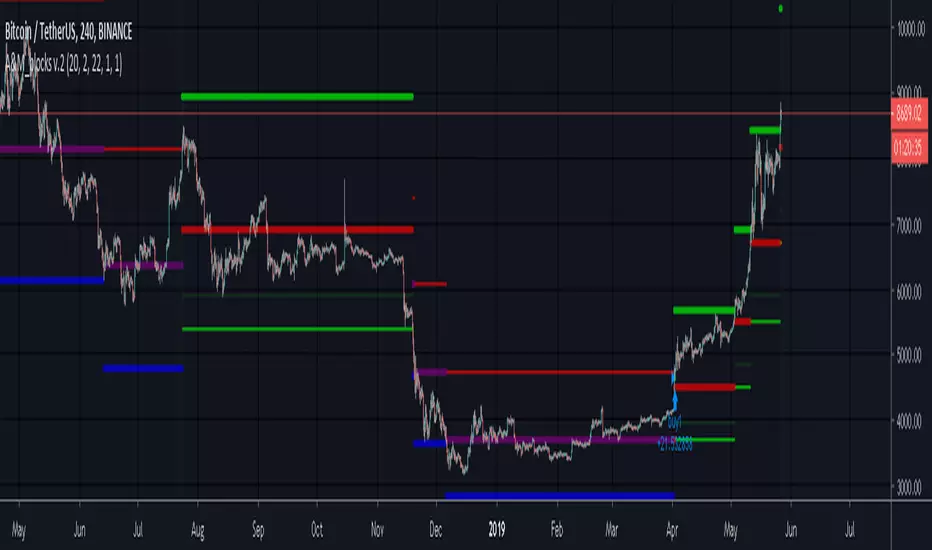
A&M_blocks v.2This is re production of Renko chart.
It draws lines that shows the location of the current box boundaries...using percentage instead of fixed box size or average true range.
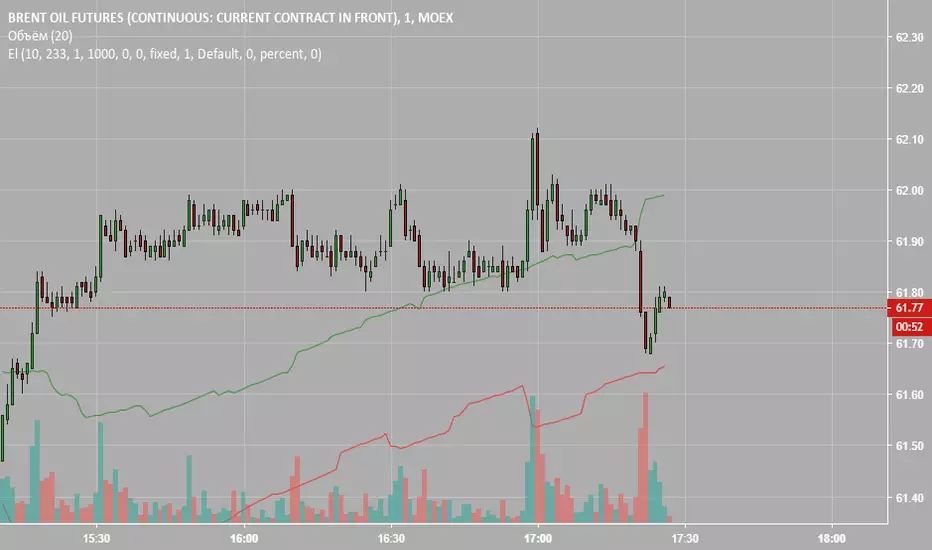
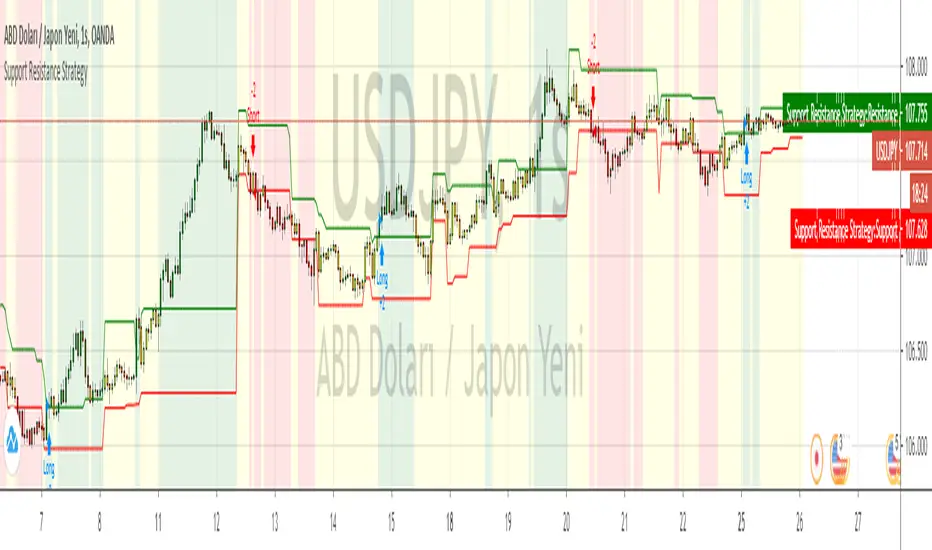
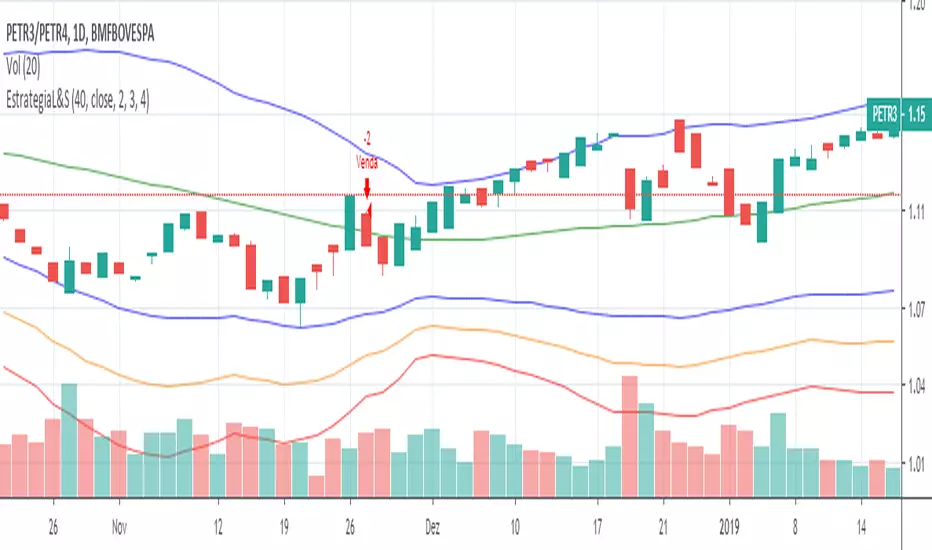
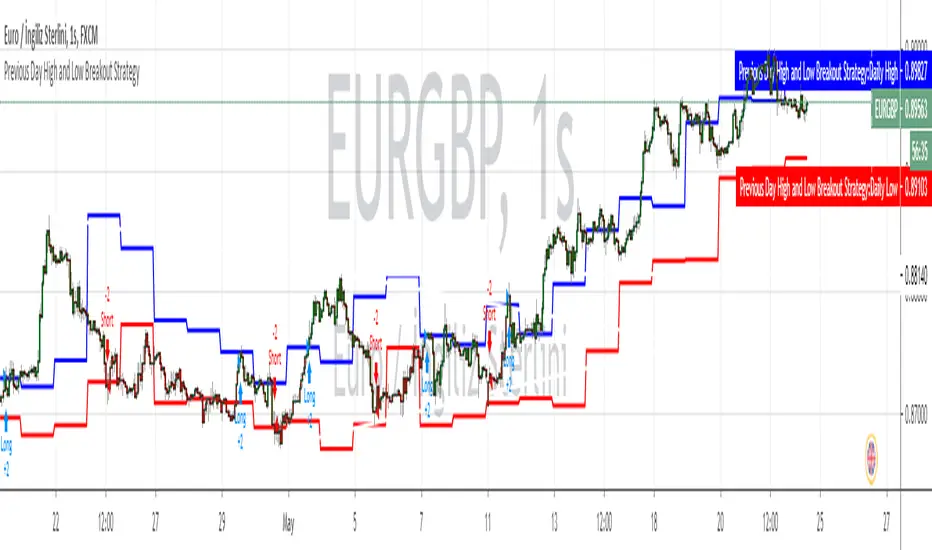
Bollinger and Tendencies (Bollinger e Tendências )The strategy consists of buying when the price breaks up (crossover) the bottom line of the Bollinger and selling when the price breaks down (crossunder) to your top line.
The chart still shows trends clearly, with the fill between the exponential average and the closing value of the canlestick, green at high, red at low (this part of the script is based on the code: "Pivot Daily Price Color" by Rimko).
It also places notes on the high and low candlesticks (based on the code: "Candlesticks Pattern Identified" by Repo32).
It is recommended to use it in conjunction with the "IFR and Storage" script (also available to me), and some volume script.
A estratégia consiste em comprar quando o preço rompe para cima (crossover) a linha inferior do Bollinger e vender quando o preço rompe para baixo (crossunder) a sua linha superior.
O gráfico ainda mostra as tendências de forma clara, com o preenchimento entre a média exponencial e o valor de fechamento do canlestick, verde em alta, vermelho em baixa (essa parte do script é baseada no código: "Pivot Daily Price Color" do usuário: Rimko).
Também, coloca apontamentos nos candlesticks de alta e de baixa (baseado no código: "Candlesticks Pattern Identified" do usuário Repo32).
Recomenda-se a utilização em conjunto com o script "IFR e Estocagem" (também por mim disponibilizado), e algum script de volume.

doncanhin channel statergydoncanhin channeldoncanhin channeldoncanhin channeldoncanhin channeldoncanhin channeldoncanhin channeldoncanhin channeldoncanhin channeldoncanhin channeldoncanhin channel


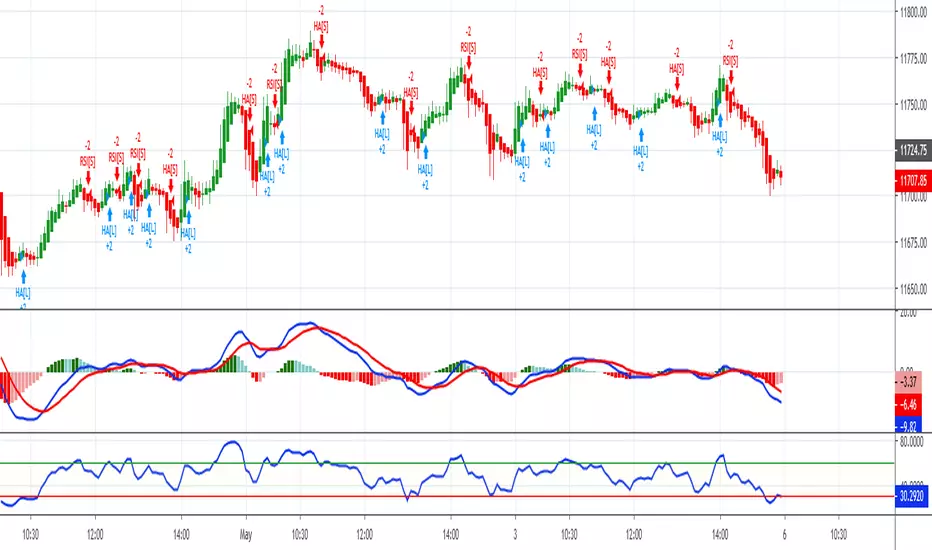
TradersVenue RSI+OHL StrategyTradersVenue RSI+OHL strategy generates buy/sell signals basis the open=high, open=low, RSI crossover above 60 and RSI crossunder 60 logic. Back testing results are good. However since it uses HeikinAshi charts exact profit will vary. But basis my trading experience its highly profitable and can be used for intraday and positional trading. This will benefit option writers to maximum as the results are quite consistent.


[Long/Short] Range Filter-ADX-SAR [BACKTEST]Backtest of the same previous script with alerts.
Range Filter + ADX + SAR + Trailing Stop + Take Profit


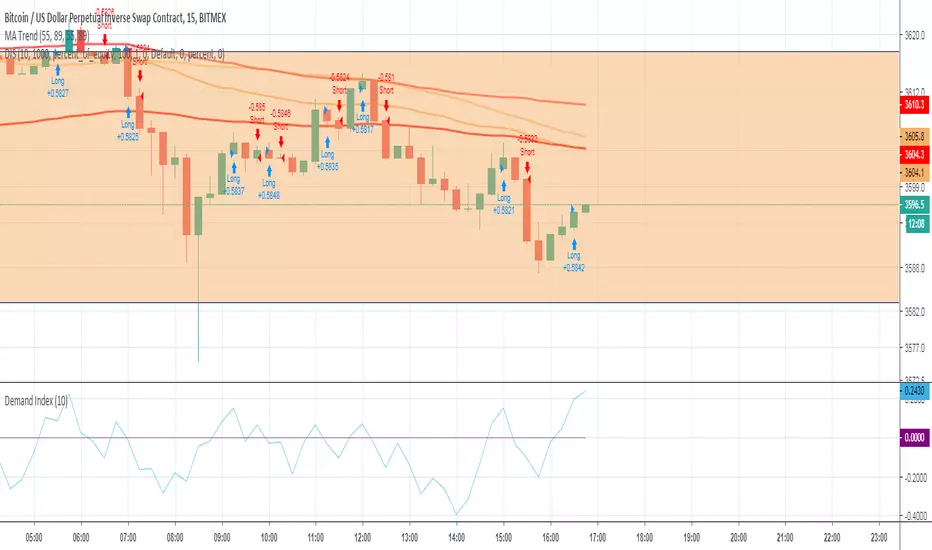
Demand Index StrategyDemand Index Strategy
Goes Long if Indicator is > 1
Goes Short if Indicator is < 1
I have no clue how and when to use it.
Please message me if you found something.