Directional Movement Index + Average Directional IndexPersonal DMI and ADX script ADX color change from positive vs negative momentum DMI Color fill based on DMI+/- positive momentum No fill color during lack of momentumIndikator Pine Script®oleh KondrackiKarlDiupdate 44535
Bitcoin Power Law CorridorOpen-source live tracker of Harold Burger's Bitcoin "Power Law Corridor". Added optional chart fill and labels to show the percentage delta to the regression center-line, support and resistance.Indikator Pine Script®oleh capriole_charlesDiupdate 1616 4.1 K
BEST Cloud ALL MAHello traders Hope you're all doing well This script is a generic cloud generator using a pre-selected set of moving averages (I probably forgot a lot but listed all the ones I used at least once). A cloud is a visual representation of the gap between two moving averages - it shows right away how big in that gap (=how far they are from each other) The challenge is to find a cloud such as the price often stay stuck between those 2 MA - and when it's getting finally out (up or down), it would be strong enough to signal a beginning of a trend. This is a cool intellectual challenge for all aspiring traders For that script, I defined a trend according to how the 2 MAs are located relative to each other (MA1 > MA2 or MA1 < MA2) and if the price gets out of the cloud. You'll get : - the option to color the candles based on a trend - cool triangles entry signals - and alerts on those triangles All the BEST DaveIndikator Pine Script®oleh Daveatt2222 2.6 K
Syminfo.TypeHello traders Earlier this week I discovered a new built-in variable called syminfo.type What is it for? This variable returns the type of the current symbol. Possible values are cfd, stock, futures, indices, forex, crypto, fund. Cool bro but... should we care? Well... we all should. Imagine you have a generic script and you want a different configuration whether you're trading FOREX or Crypto . I designed a dummy example in that script that will preset the inputs according to the asset type from the chart. Here I want 12/26/9 for forex and 20/50/50 for crypto - 30/60/90 otherwise Quick caveat It seems that for any crypto asset, syminfo.type returns "bitcoin". TradingView will fix it at some point but wanted to give you the heads-up regardless Enjoy and all the BEST ^^ -- DaveIndikator Pine Script®oleh Daveatt9967
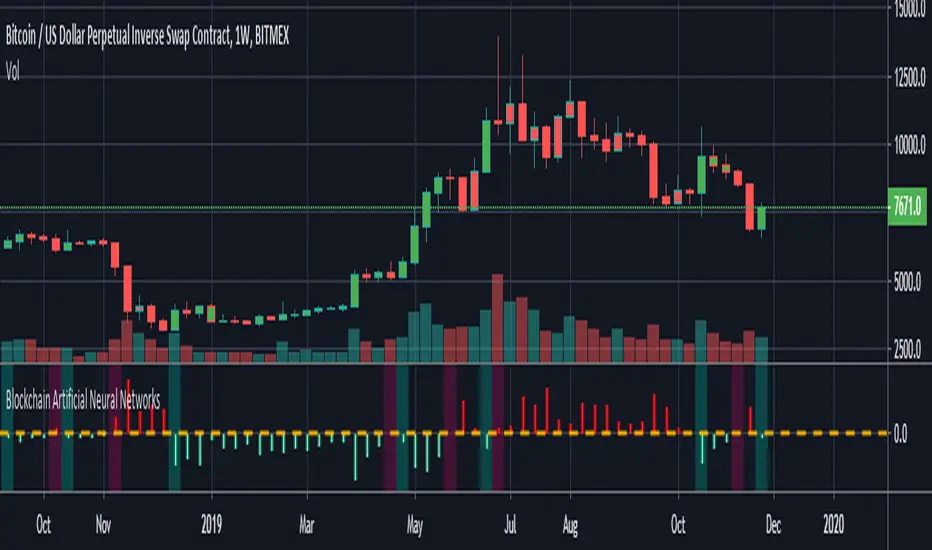
Blockchain Artificial Neural NetworksI found a very high correlation in a research-based Artificial Neural Networks.(ANN) Trained only on daily bars with blockchain data and Bitcoin closing price. NOTE: It does not repaint strictly during the weekly time frame. (TF = 1W) Use only for Bitcoin . Blockchain data can be repainted in the daily time zone according to the description time. Alarms are available. And you can also paint bar colors from the menu by region. After making reminders, let's share the details of this interesting research: INPUTS : 1. Average Block Size 2. Api Blockchain Size 3. Miners Revenue 4. Hash Rate 5. Bitcoin Cost Per Transaction 6. Bitcoin USD Exchange Trade Volume 7. Bitcoin Total Number of Transactions OUTPUTS : 1. One day next price close (Historical) TRAINING DETAILS : Learning cycles: 1096436 AutoSave cycles: 100 Grid : Input columns: 7 Output columns: 1 Excluded columns: 0 Training example rows: 446 Validating example rows: 0 Querying example rows: 0 Excluded example rows: 0 Duplicated example rows: 0 Network : Input nodes connected: 7 Hidden layer 1 nodes: 5 Hidden layer 2 nodes: 0 Hidden layer 3 nodes: 0 Output nodes: 1 Controls : Learning rate: 0.1000 Momentum: 0.8000 Target error: 0.0100 Training error: 0.010571 The average training error is really low, almost worth the target. Without using technical analysis data, we established Artificial Neural Networks with blockchain data. Interesting!Indikator Pine Script®oleh Noldo1717838
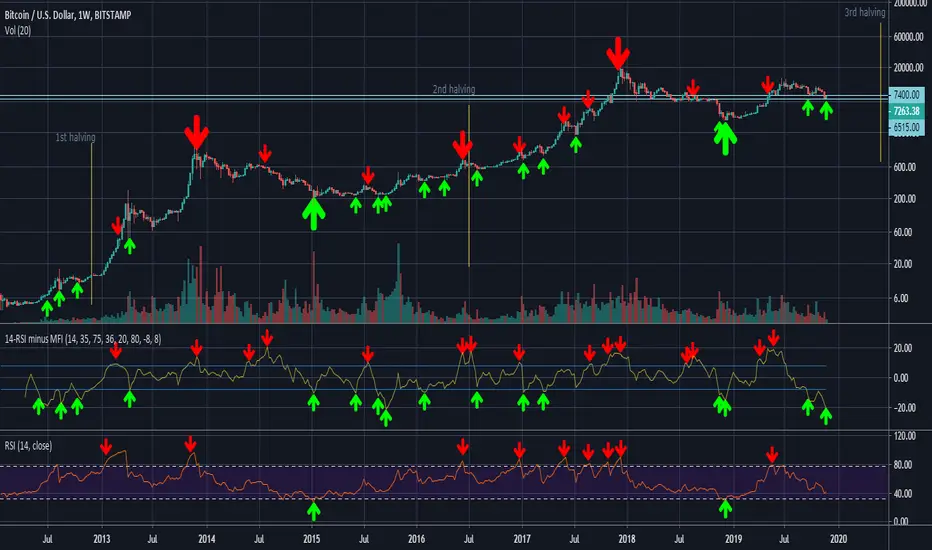
14-RSI minus 36-MFI (weekly)On the weekly chart of BTC/USD, the difference between the 14-RSI and the 36-MFI, combined with the 14-RSI alone, gives good buy and sell signals.Indikator Pine Script®oleh anon241469166413
UT Bot StrategyUT Bot indicator was inially developer by @Yo_adriiiiaan Idea of original code belongs @HPotter I just took code of Yo_adriiiiaan, cleaned it, deleted all useless pieces of code, transformet to v4 and created a strategy from it. Also I added an input that allows you to swich to signals from Heiking Ashi. I saw that author uses HA for the indicator and on HA it look much nices then on real candles. Do not add this strategy to HA candles, use usual candles and this checkbox. Original script: Strategi Pine Script®oleh QuantNomad8585 7.1 K
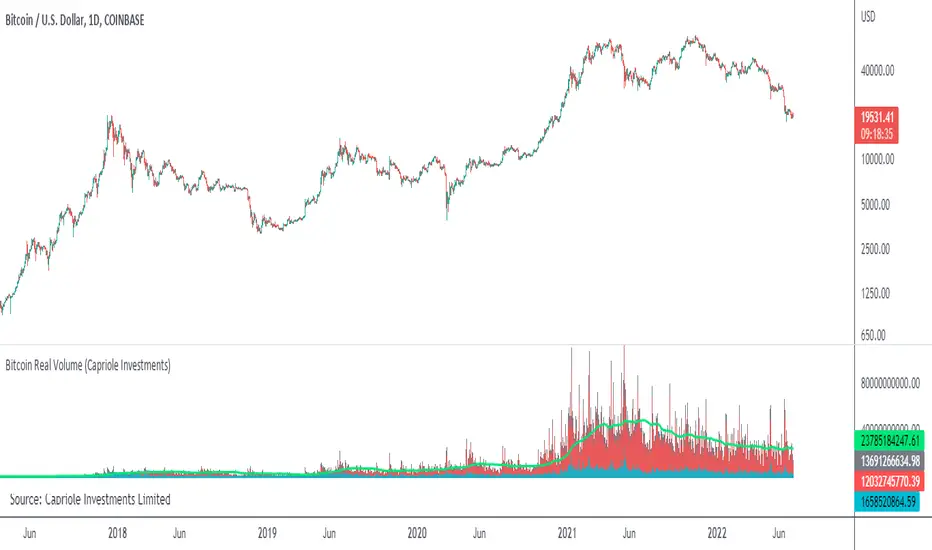
Bitcoin Real VolumeBitcoin’s Real Volume An accurate read on the change in Bitcoin’s volume profile over time. Based on 2019 reports by Bitwise and Alameda Research. Please see the script code notes for assumptions and details on data selection. Follow me for more information on this script.Indikator Pine Script®oleh capriole_charlesDiupdate 1313673
Multi-Exchange Volume (30 Tickers) by kurtsmock + BV + rVolauthor: kurtsmock Fully Customizable ticker set. Up to 30 Tickers. Bitcoin set as default. -- IMPORTANT NOTE: -- 30 Exchanges are a lot. It can take a while to load. You can fully customize this indicator to your liking. Here's how: 1. Load indicator 2. Open Settings 3. Uncheck the switch box for exchanges you want unincluded 4. At the bottom of the settings menu click "Defaults" and hit "Save as Default" 5. To turn them all back on, hit "Reset Settings" in that same "Defaults" menu and click "Save as Default" again. Also, you don't have to use this with Bitcoin. This works with any asset, just change the ticker in the settings. There's a lot going on with this indicator so the following is descriptions and instructions to help you better understand what's going on here. Thanks! Goal: - To provide a mechanism for assets on multiple exchanges to have their volume evaluated together Edge: - Having better and more complete volume information Notes: - The Default Exchanges for this indicator are highest volume bitcoin exchanges, but may contain "fake volume" - Indicator is set for Bitcoin by default. However, you can change the tickers to reflect any asset you want ////// rVol ////// Goal: - To understand how much volume is being executed relative to the same candle on previous days/periods Edge: - Higher rVol implies higher volatility and market interest. - High rVol = higher than average volume . Markets move on volume so higher than average volume indicates increased market activity/volatility - rVol is an indirect measure of active or anticipated volatility Definitions: - rVol: The volume of a period compared to the Average Volume of that same period in past sessions - Important to note it does NOT add up the last 10 (default) candles, but rather the last 10 candles at session intervals. - Example: -- On a Tuesday, 1h chart it will add up the last ten Tuesday, 9:00 am candles, not including the current, active candle. -- It then averages those lookback candles. -- It then plots the percentage relationship between the most recent candle and the average of the lookback candles -- Avg Vol of Lookback candles = 5000, -- Volume of most recent candle = 4000: Output = rVol = 80: -- Volume of most recent candle was 80% of the average volume in the 9 am time period of the last ten Tuesdays in the 9 am, 1h period Notes: - rVol does not add current candle volume into lookback sum. So, you set lookback to be: (not including the current day) - rVol is on a switch. So, if you want to see rVol instead of volume, hit the switch in the settings - If you want to see both, load 2 instances of the indicator. ////// Better-er Volume ////// Goal: To Identify: - When a candle closes at the highest volume * range relative to the lookback period and close > open - When a candle closes at the highest volume * range relative to the lookback period and close < open - When a candle closes at the highest volume / price relative to the lookback period Edge: - Identifies beginnings of price expansion, climax of price expansion, breakouts, pivots, and take profit points on the volume chart Notes: - Based generally on Barry Taylor's "Better Volume" indicator and ideas from Pascal Willain's book "Value in Time." - Better-er Volume rules are applied to both Total Volume or rVol. -- When rVol is displayed Better-er Volume is applied to rVol -- When Total Volume is displayed Better-er Volume is applied to Total Volume // Plot Key: // Green Triangle Up = Often marks the beginning and/or end of price expansion to the upside Red Triangle Up = Often marks the beginning and/or end of price expansion to the downside Yellow Square = High Volume but Tight Range. Implies a Battle of Bulls and Bears. High Liquidity area. Provided Liquidity is not enough to move price. Thick Limit Order Book. Purple Triangle Up or Down = Implies high market participation. Typically at the end of expansion when very significant s/r is hit category: volume Volatility tags: Volume rVol relativevolume Bitcoin cryptocurrency bettervolume Many More Volume Indicators Coming Out Soon!Indikator Pine Script®oleh kurtsmockDiupdate 11230
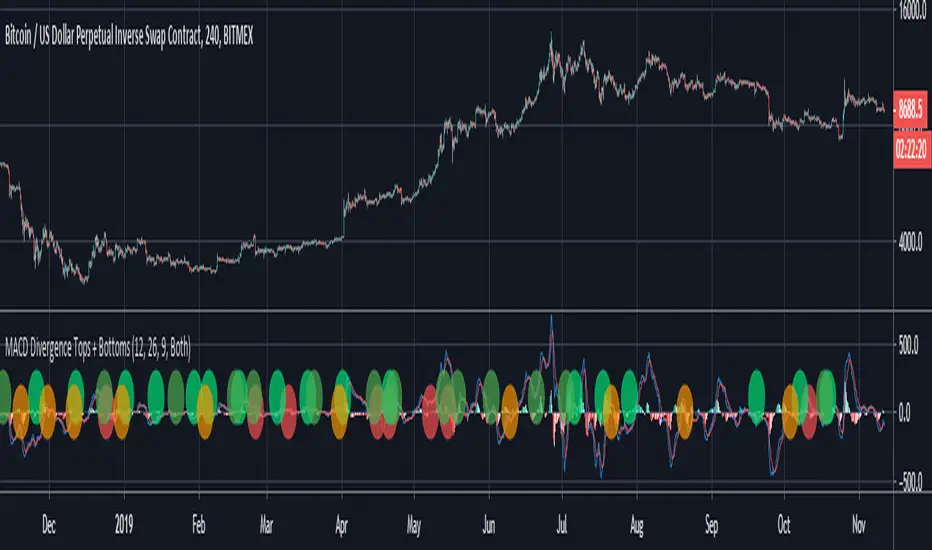
MACD Divergence Tops + BottomsMACD Indicator which plots local peaks and troughs in divergence. "Classic" Divergence is specified as: - A higher price, with reduced MACD high --> Potential Sell Point - A lower price, with higher MACD low --> Potential Buy Point "Alternative" Divergence is specified as: - A higher MACD high, with reduced price --> Potential Sell Point - A lower MACD low, with higher price --> Potential Buy Point MACD Divergence should be used in combination with other indicators. This indicator identifies local tops and bottoms, with potential for macro trend shifts.Indikator Pine Script®oleh capriole_charles55821
QuantNomad - Significant Pivot Reversal Strategy AlertsAlerts for "Significant Pivot Reversal Strategy": As one of the ways to filter out insignificant levels I decided to check that pivot point is not above/below neighbors, but check that it's above/below at least by a certain amount. I use ATR, so in params, you can set length of ATR and also ATR multiplier. The new level will be calculated only if PP will be above/below neighbors by atr * atr_mult. It seems this approach might help in some cases.Indikator Pine Script®oleh QuantNomad11277
QuantNomad - EVWMA MACD StrategyPretty simple EVWMA (Elastic Volume Weighted Moving Average ) MACD Strategy. EVWMA is a quite interesting moving average where the period of the MA is defined from the volume itself. It incorporates volume information in a natural and logical way. The EVWMA can be looked at as an approximation to the average price paid per share. As a volume period, you can use sum of the last x bars volumes. Here are other EVWMA indicators/strategies: EVWMA indicator: EVWMA Cross strategy: Strategi Pine Script®oleh QuantNomad11362
QuantNomad - EVWMA Cross StrategyPretty simple EVWMA (Elastic Volume Weighted Moving Average) Cross Strategy. Long on bullish cross, Short on Bearish Crosss. EVWMA is a quite interesting moving average where period of the MA is defined from volume itself. It incorporates volume information in a natural and logical way. The eVWMA can be looked at as an approximation to the average price paid per share. As a volume period you can use sum of the last x bars volumes. Here is EVWMA as an indicator: Strategi Pine Script®oleh QuantNomad22281
Hash RibbonsBuying during Miner Capitulation yields wonderful returns. The best buy signals occur on Hash Rate "recovery", and when price momentum is also positive. Historically, this strategy has yielded average returns to cycle peak of >5000%, with max Drawdown of -15%. Follow me to learn more about this indicator.Indikator Pine Script®oleh capriole_charlesDiupdate 185185 15.5 K
BTC Volume absolute (fiat vs Tether vs futures)BTC volume split by fiat, Tether and futures in USD fiat = COINBASE + BITFLYER + BITSTAMP + KRAKEN Tether = BITFINEX + BINANCE + HUOBI + HITBTC futures = BITMEX + BYBITIndikator Pine Script®oleh mr_NuTzDiupdate 82
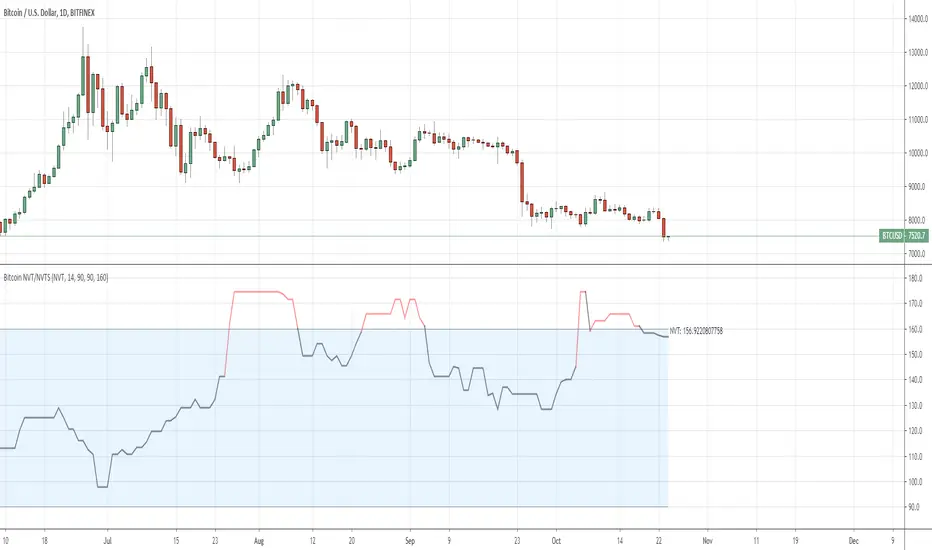
QuantNomad - Bitcoin NVT/NVTSIn this script I included 2 quite interesting indicators for Bitcoin: * NVT (Network Value to Transactions Ratio) * NVTS (NVT Signal) Both indicators are based on Bitcoin Network Value (Market Cap) and 24h transaction volume. For both these values I'm using Quandl datasets from Blockchainc.com: market_cap: QUANDL:BCHAIN/MKTCP transac_vol: QUANDL:BCHAIN/ETRVU Calculation for both indicators are pretty simple: NVT = median(market_cap / transac_vol, 14 bars) NVTS = market_cap / sma(transac_vol, 90 bars) NVT and NVTS are cryptocurrency's answers to P/E ratio. They can help you to understand if bitcoin is under/overvalued. When NVT or NVTS is relatively high it can be a pretty good point to short bitcoin, if it's low it good time to buy bitcoin. NVT Ratio - was created by Willy Woo NVT Signal - was created by Dimitry Kalichkin Because of different sources of transaction volume data, these indicators can differ in values from originals, but magnitude should be the same. This is a pretty simple example where you can select only static overbought/oversold levels and when indicator will be above/below it you will see in changing in color. I have many more things in my head how these indicators can be developed further and what strategies can be derived from them, but as is they can be a pretty good base for you. Will share my advanced findings later. Indikator Pine Script®oleh QuantNomad11491
ANN MACD BTC v2.0 This script is the 2nd version of the BTC Deep Learning (ANN) system. Created with the following indicators and tools: RSI MACD MOM Bollinger Bands Guppy Exponential Moving Averages: (3,5,8,10,12,15,30,35,40,45,50,60) Note: I was inspired by the CM Guppy Ema script. Thank you very much to dear wroclai for his great help. He has been a big help in the deep learning series. That's why the licenses in this series are for both of us. I'm sharing these series and thats the first. Stay tuned and regards! Note : Alerts added.Indikator Pine Script®oleh Noldo1313264
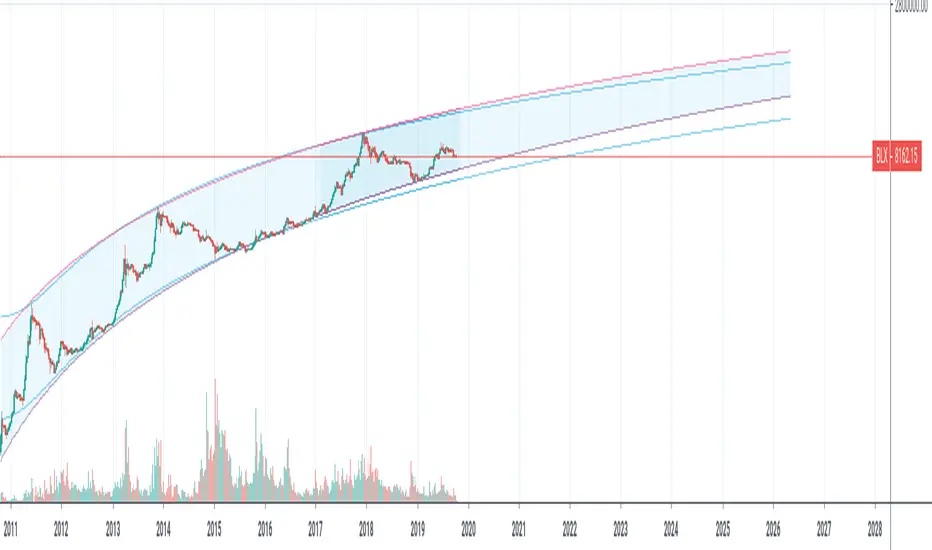
Bitcoin Logarithmic Growth CurvesThis plots logarithmic curves fitted to major Bitcoin bear market tops & bottoms. Top line is fitted to bull tops, bottom line is fitted to lower areas of the logarithmic price trend (which is not always the same as bear market bottoms). Middle line is the median of the top & bottom, and the faded solid lines are fibonacci levels in between. Inspired by & based on a Medium post by Harold Christopher Burger, which shows how linear Bitcoin's long-term price growth is when plotted on a double-log chart (log scaling on the price AND time axis). These curves will only make sense for tickers representing Bitcoin vs. USD (such as BITSTAMP:BTCUSD, BITMEX:XBTUSD, BLX index). Plotting on other assets will probably end up with lines that shoot off into space without any relationship to the underlying price action. The upper, middle & lower curves can be projected into the future, which can be turned on or off in the indicator settings. The fibonacci levels can also be switched on/off. And the upper & lower curve intercepts & slopes can be tweaked. I'm releasing this open-source, if you end up making something cool based off of this code, I don't need attribution but please hit me up on here or on twitter (same username) so I can check out what ya made. Thanks, hope y'all enjoy it.Indikator Pine Script®oleh quantadelicDiupdate 4949 5 K
Yope BTC PL channelThis is a new version of the old "Yope BTC tops channel", but modified to reflect a power-law curve fitted, similar to the model proposed by Harold Christopher Burger in his medium article "Bitcoin’s natural long-term power-law corridor of growth". My original tops channel fitting is still there for comparison. In fact, it looks like the old tops channel was a bit too pessimistic. Note that these channels are still pure naive curve-fitting, and do not represent an underlying model that explains it, like is the case for PlanB's "Modeling Bitcoin's Value with Scarcity" which uses Stock-to-Flow. The motivation for this exercise is to observe how long this empirical extrapolation is valid. Will the price of bitcoin stay in either of both channels? Note on usage: This script _only_ works with the BLX "BraveNewCoin Liquid Index for Bitcoin" in the 1D, 3D and 1W time-frames! It may be necessary to zoom in and out a few times to overcome drawing glitches caused by the extreme time-shifting of plots in order to draw the extrapolated part.Indikator Pine Script®oleh yope219
NVT Dynamic Colored with Signals [aamonkey]NVT Dynamic This is the dynamic version of my " Bitcoin Network Value to Transactions " indicator. The dynamic NVT indicator is based on the Network Value to Transactions. Definition: NVT = Network Value / Daily Transaction Volume Advantages: Because BTC is a very young asset, it can be a good idea to have relatively high and low NVT values that change over time. Signals: When the NVT turns green = buy opportunity NVT turns red = sell opportunity Indikator Pine Script®oleh aamonkey88518
Bitcoin Difficulty Model [aamonkey]This is a model to calculate Bitcoin price based on Difficulty. How to calculate it: BDM = (difficulty^0.51) * 0.002 For the difficulty, the daily average is used.Indikator Pine Script®oleh aamonkey135
Super Trend Daily BF 🚀Super Trend is based on volatility and attempts to show the overall greater trend of a market. Thanks to everget for the idea of improving the Super Trend code. Thanks to kiasaki for ROC code. The idea here is to enter a trade upon trend reversal (unless we have a white background - this indicates choppy/sideways market). INSTRUCTIONS Follow the background color for signals of a trend reversal. Bright green = long Bright red = short White = no trade We use a fixed stop loss here of 6% but I have included the option to apply an ATR based stop loss in Settings. No take profit. No re-entering until we get an opposing signal. I use a Rate of Change function to detect when we should stay out due to choppy sideways price action. This strategy was optimised for XBT/USD on Bitmex 1 day chart, ideal settings for other pairs will differ. Strategi Pine Script®oleh bennefDiupdate 1313617
REAL STRATEGY : Dow_Factor_MFI/RSI_DVOG_StrategyI'm actually one of those who think it's more important to extract clues from indicators than strategy, but I wanted to test the data about the probability and dow factor I've shared for a long time. Usually, Bitcoin is used as an eye stain for strategy success, since the graph has increased significantly from the beginning. To prevent this, I used a commission and in the last lines of document I shared Bitmex's Bitcoin and Ethereum 1W test results. I don't think there's a factor to repaint. ( Warn me if u see or observe ) I considered Bitcoin because I found working with liquid parities much more realistic. Ethereum and Bitmex have been featured as a spot and may soon find a place at the CME , so I've evaluated the Ethereum . But since the Ethereum Bitmex was also spot new, I deleted results that were less than 10 closed trades. Since the Dow Theory also looks at the harmony in the indices, just try it in the Cryptocurrency market. Use as indicator in other markets. Support with channels, trend lines with big periods and other supportive indicators. And my personal suggestion : Use this script and indicator TF : 4H and above. Specifications : Commission. ( % 0.125 ) Switchable Methods ( Relative Strength Index / Money Flow Index ) Alarms. (Buy / Sell ) Position closure when horizontal market rates weighs. Progressive gradual buy/sell alarms. Clean code layout that will not cause repaint. (Caution : source = close ) Switchable barcolor option (I / 0 ) *****Test results :***** drive.google.com Summary: It was a realistic test. It has achieved great success in some markets, but as I mentioned earlier, use it only to gain insight into the price movements of cryptos. Use as indicator in other markets. This code is open source under the MIT license. If you have any improvements or corrections to suggest, please send me a pull request via the github repository : github.com Stay tuned ! Noldo.Strategi Pine Script®oleh NoldoDiupdate 44830