Bitcoin (Mata Uang Crypto)

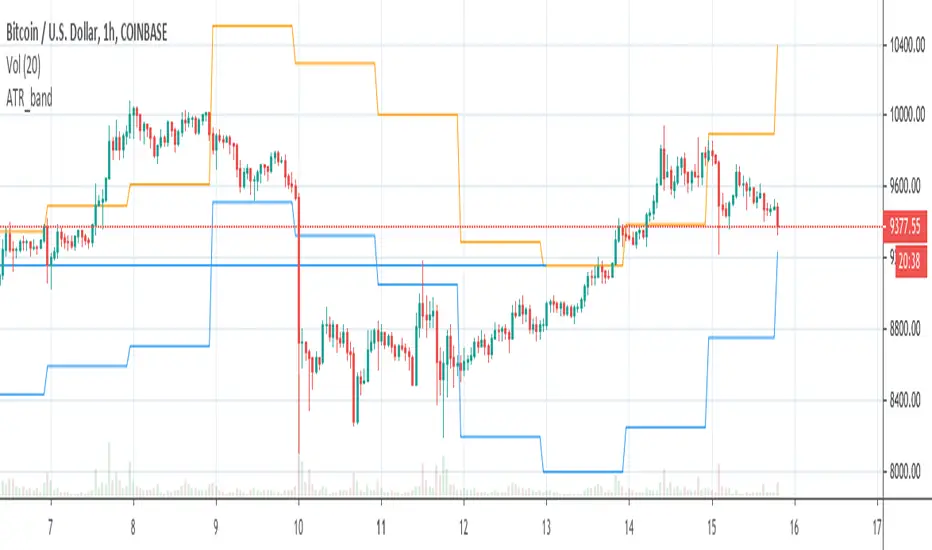
ATR_bandCreates lower and upper band on BTCUSD chart based on ATR value of the previous day and daily open of the current day
BTC and ETH Long strategy - version 1I will start with a small introduction about myself. I'm now trading cryto currencies manually for almost 2 years. I decided to start after watching a documentary on the TV showing people who made big money during the Bitcoin pump which happened at the end of 2017.
The next day, I asked myself "Why should I not give it a try and learn how to trade".
This was in February 2018 and the price of Bitcoin was around 11500USD.
I didn't know how to trade. In fact, I didn't know the trading industry at all.
So, my first step into trading was to open an account with a broken. Then I directly bought 200$ worst of BTC . At that time, I saw the graph and thought "This can only go back in the upward direction!" :)
I didn't know anything about Stop loss, Take profit and Risk management.
Today, almost 2 years after, I think that I know how to trade and can also confirm that I still hold this bag of 200$ of bitcoin from 2018 :)
I did spend the 2 last years to learn technical analysis , risk management and leverage trading.
Today (14/05/2020), I know what I'm doing and I'm happy to see that the 2 last years have been positive in terms of gains. Of course, I did not make crazy money with my saving but at least I made more than if I would have kept it in my bank account.
Even if I like trading, I have a full time job which requires my full energy and lots of focus, so, the biggest problem I had is that I didn't have enough time to look at the charts.
Also, I realized that sometimes, neither technical analysis , nor fundamentals worked with crypto currency (at least for short time trading). So, as I have a developer background I decided to try to have a look at algo trading.
The goal for me was neither to make complex algos nor to beat the market but just to automate my trading with simple bot catching the big waves.
I then started to take a look at TV pine script and played with it.
I did my first LONG script in February 2020 to Long the BTC Market. It has some limitations but works well enough for me for the time being. Even if the real trades will bring me half of what the back testing shows, this will still be a lot more than what I was used to win during the last 2 years with my manual trading.
So, here we are! Below you will find some details about my first LONG script. I'm happy to share it with you.
Feel free to play with it, give your comments and bring improvements to it.
But please note that it only works fine with the candle size and crypto pair that I have mentioned below. If you use other settings this algo might loose money!
- Crypto pairs : XBTUSD and ETHXBT
- Candle size: 2 Hours
- Indicator used: Volatility , MACD (12, 26, 7), SMA (100), SMA (200), EMA (20)
- Default StopLoss: -1.5%
- Entry in position if: Volatility < 2%
AND MACD moving up
AND AME (20) moving up
AND SMA (100) moving up
AND SMA (200) moving up
AND EMA (20) > SAM (100)
AND SMA (100) > SMA (200)
- Exit the postion if: Stoploss is reached
OR EMA (20) crossUnder SMA (100)
Here is a summary of the results for this script:
XBTUSD : 01/01/2019 --> 14/05/2020 = +107%
ETHXBT : 01/01/2019 --> 14/05/2020 = +39%
ETHUSD : 01/01/2019 --> 14/05/2020 = +112%
It is far away from being perfect. There are still plenty of things which can be done to improve it but I just wanted to share it :) .
Enjoy playing with it....

Golden Ratio MultiplesI call this "Phi Ribbons." The Golden Ratio, also known as Phi, is fantastic at predicting areas of price reversal.
Every moving average is a fibonacci multiple of the base function 355 SMA .
The rainbow above is an array of fibonacci multiples that are greater than one (1.618, 2, 2.618, 3, 5, 8, 13, 21)
The rainbow below is an array of fibonacci multiples that are less than one (0.786, 0.618, 0.5, 0.382, 0.236, 0.14)
Notice the precision of marking areas of potential price reversals
EASTER EGG: The two moving averages at the top of the script are 355 SMA & 113 SMA . This is one of the lowest ratios that closely approximates Pi (3.14159).
Simply plotting the 133 SMA will add a unique feature:
355/133 = 3.14159
When the 113 crosses below the 355 it tends to mark the end of major bullish impulses, and a crossover is a bullish sign.

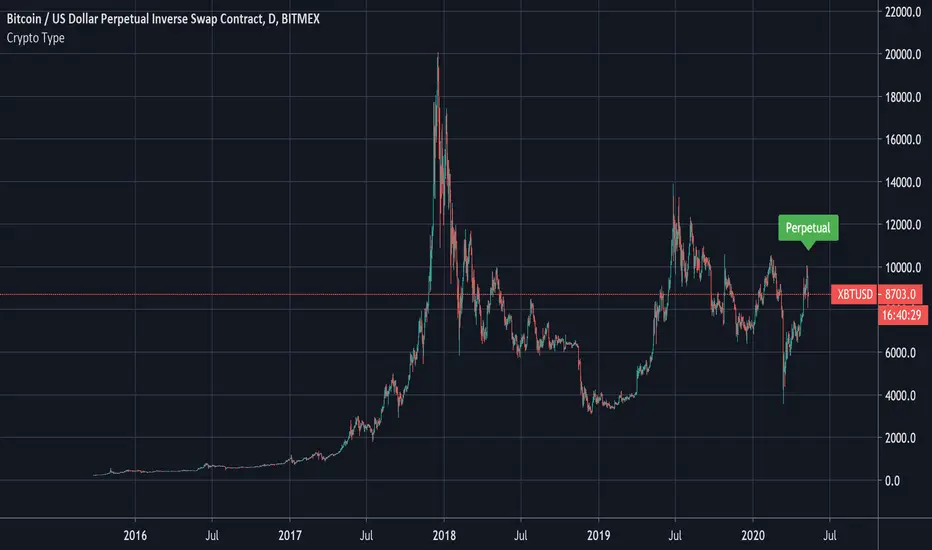
Crypto Type: Regular, Perpetual, Or Futures?A simple way to find out if the security in question is a regular, perpetual, or futures pair.
This reads the data of the security's description and sees if the word perpetual or futures is mentioned.
The method to check if a string has the letters we seek was first introduced by MichelT .
Thank you for checking this out and I hope this helps unlocking new hidden potential.
Bitcoin SpreadThis indicator display the current lowest and the highest value of btc on a set of exchanges for a define type of market.
Bitcoin Spread was originally made by @DayTradingItalia, i have bring his indicator to pine v4, add add some stuff to it:
5 Type of BTC Market : USDT Swap, USD and Futures (current/next contract)
Spread value

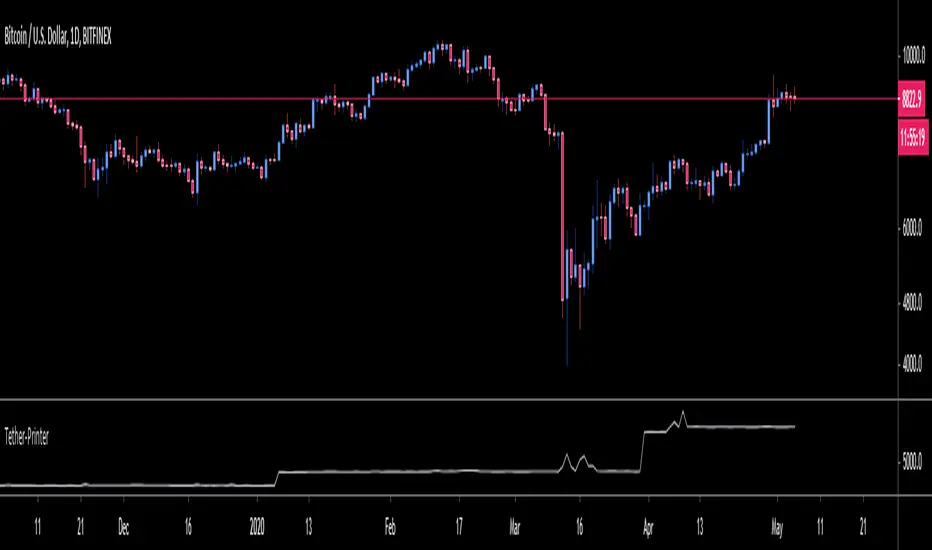
OneGeenCandle - Tether-Printer**************** OnegreenCandle - Tether Printer ************************
Shows the total market cap of USDT (US Dollar Tether) currency. Helpful for swing trading longer timeframes and indentifying new supply in the crypto market.
Buy the dip in Bull Market by BensonBuy the dip in Bull Market by Benson
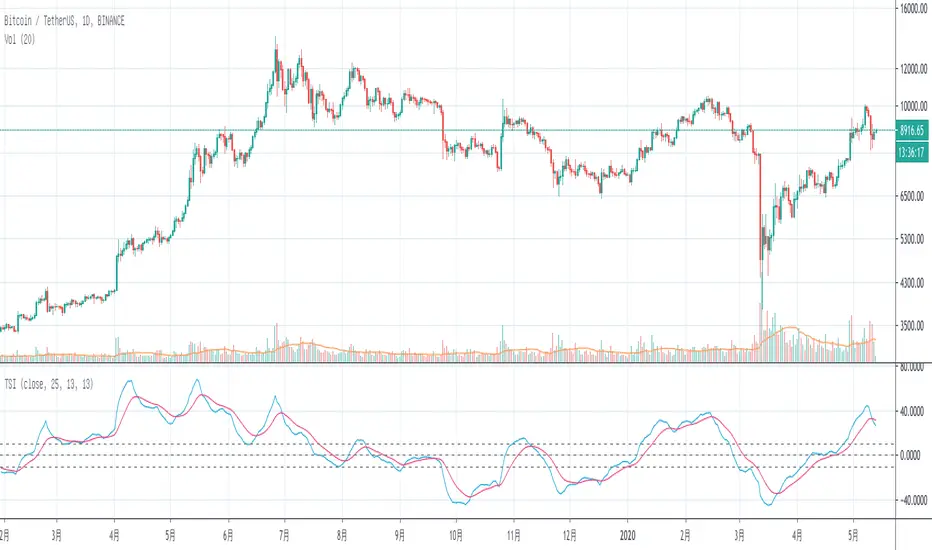
This indicators is used for showing buying timing in bull market, buy BTC when the index is below 0.
牛市作多指標 By Benson
在指標下穿零軸時買入 BTC

msoro daily DCATool to estimate PnL of your investment if you put in a fixed $ amount daily into btc for past year. It takes input as 365 days which can be changed as per need.

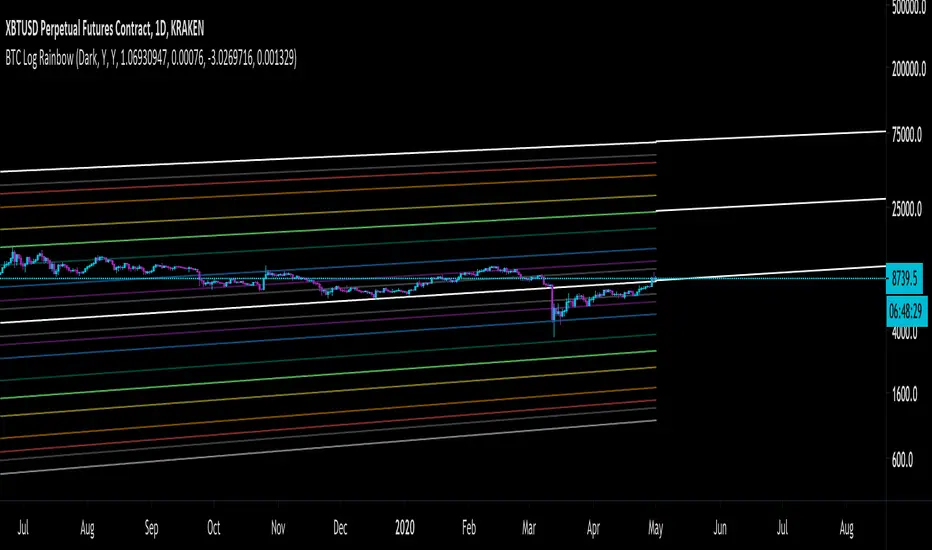
Bitcoin Fibonacci Log RegressionThe "Zero Line" is the calculated logarithmic regression of Bitcoin over the last decade.
The rainbow above the Zero Line are the Fibonacci multiples from 0 --> 1 of the log regression (0.236, 0.382, etc.)
The rainbow below the Zero Line is identical, except that the multiples are negative (-0.236, -0.382, etc.)
For the first time ever, Bitcoin broke through the Zero Line (the natural regression) when it dumped on March 12-13. It looked at though the regression was invalidated when, in fact, it simply made an unprecedented move to a lower Fibonacci multiple.
Enjoy.
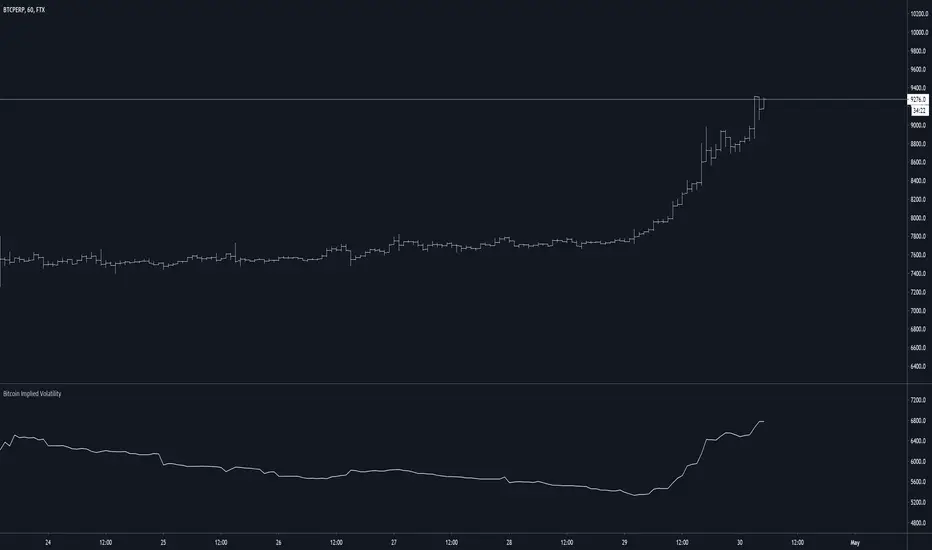
Bitcoin Implied VolatilityThis simple script collects data from FTX:BVOLUSD to plot BTC’s implied volatility as a standalone indicator instead of a chart.
Implied volatility is used to gauge future volatility and often used in options trading.
eha MA CrossIn the study of time series, and specifically technical analysis of the stock market, a moving-average cross occurs when, the traces of plotting of two moving averages each based on different degrees of smoothing cross each other. Although it does not predict future direction but at least shows trends.
This indicator uses two moving averages, a slower moving average and a faster-moving average. The faster moving average is a short term moving average. A short term moving average is faster because it only considers prices over a short period of time and is thus more reactive to daily price changes.
On the other hand, a long term moving average is deemed slower as it encapsulates prices over a longer period and is more passive. However, it tends to smooth out price noises which are often reflected in short term moving averages.
There are a bunch of parameters that you can set on this indicator based on your needs.
Moving Averages Algorithm
You can choose between three types provided of Algorithms
Simple Moving Average
Exponential Moving Average
Weighted Moving Average
I will update this study with more educational materials in the near future so be informed by following the study and let me know what you think about it.
Please hit the like button if this study is useful for you.

SMA Cross strategyThis is a simple strategy which is always profitable and trades better than most premium channels and I give it out for free :)
Working very good on ETHUSDT futures on binance :)

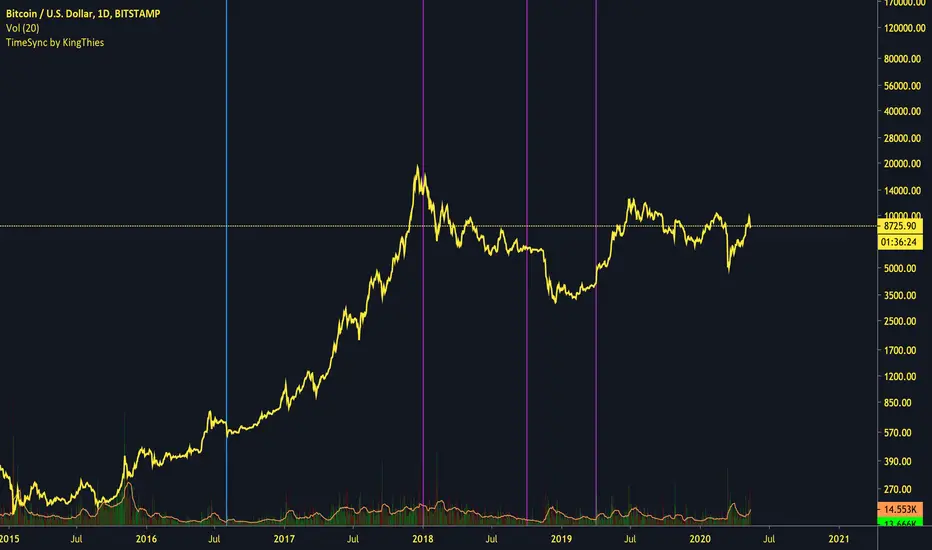
TimeSync by KingThies TimeSync by Kingthies
Written in Pine v4
Applies one function that was published in the Tradingview Pinescript Manual
The Motivation behind this script - Time is 50% of your chart. Many ignore it entirely. This should help give an idea on how to read it and incorporate it in their analysis.
TimeSync by KingThies takes a simple concept and turns it into a visual tracking system of when timeframes of significant impact, all close at the same time.
By utilizing several high time-frames, we see overlaps in periods and more significant events occurring when multiple periods close at once.
The TFs included are 3D,1W,2W and 1M. When users use the timeframes above intraday, the resolution for these HTF's is shown. When using the LTFs, anything lower than 1D/is intraday, the user sees a similar concept but comprised of the 4H, 6H,8H and 10H charts.
Users can adjust the settings to show the HTFs in sync AND also factor in if the event was on a business quarter or new year, which adds more significance to the occurrence.
By seeing when these periods end in sync, we can assume more volatility is present in a given market, presenting various opportunities for traders to take advantage of a given situation.
Apologies in advance for any questions that come up - I will do my best to reply or respond here on Tradingview.com.
Additional Resources for this topic can be found in my account signature, located at the bottom of this post.
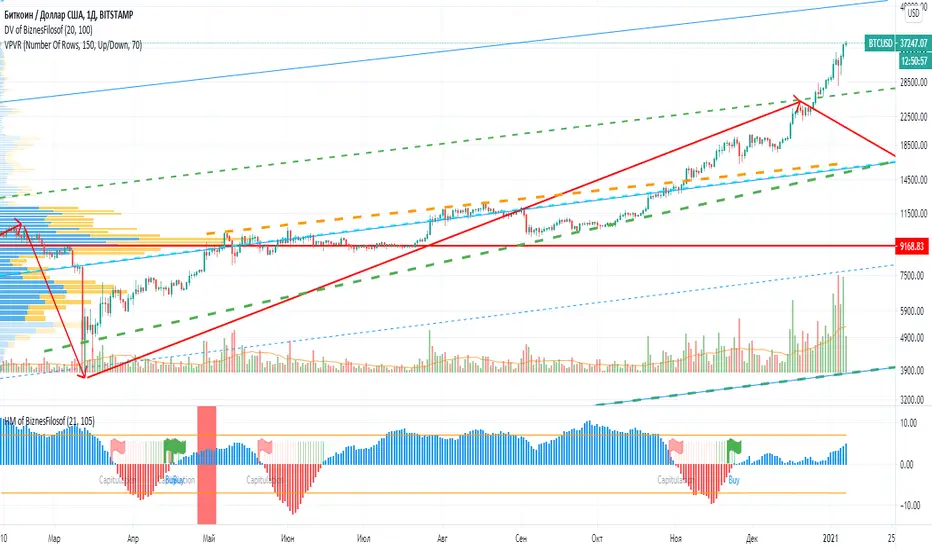
Hashrate Mining of BiznesFilosofIn addition to technical analysis, you also need to pay attention to fundamental analysis. Bitcoin has one of these indicators, it is the network hashrate. And it’s important to know when mining becomes disadvantageous. Those. when network participants turn off the equipment. And there are critical points that depend on the price and number of miners in the network.
When the blue bars of the indicator grow, then you can stand in long. When stools are reduced, then it is time to close positions or hedge risks in the derivatives market.
The vertical line indicates halving.
A red flag indicates a dangerous moment, and a green flag indicates the time of purchase.
The oscillator is based on fundamental indicators and the intersection of moving averages.
===
Кроме теханализа нужно ещё обращать внимание на фундаментальный анализ. У биткоина один из таких показателей, это хэшрейт сети. И важно зать, когда майнинг становится невыгоден. Т.е. когда участники сети отключают оборудование. И есть критические точки, зависящие от цены и количества майнеров в сети.
Когда синие столбики индикатора растут, тогда можно стоять в лонг. Когда столюики уменьшаются, тогда пора закрывать позиции или хеджировать риски на рынке деривативов.
Вертикальной линией обозначен халвинг.
Красный флаг показывает опасный момент, а зелёный флаг указывает на время покупок.
Осцилятор основан на фундаментальных показателях и пересечении скользящих средних.
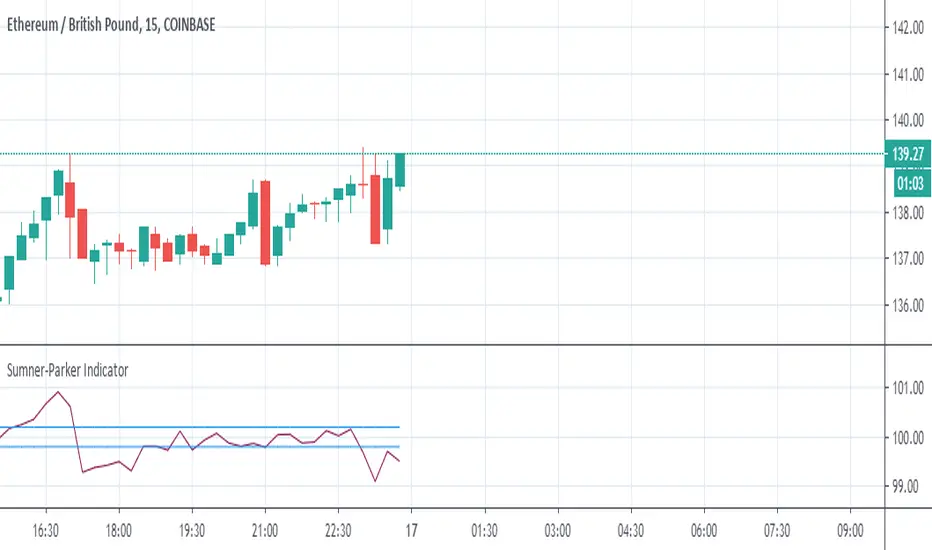
Sumner-Parker Indicator (Over/Under Priced BTC or ETH)This is to be used when trading between ETH/GBP, BTC/GBP and ETH/BTC .
It compares ETH/GBP and BTC/GBP with each other to determine if the ETH/BTC price matches.
From it you can predetermine whether the value of the asset you are watching is overpriced or underpriced and therefore predict the candle to follow.
When watching ETH:
If the value is high, the value of BTC is too high and ETH should raise to match in the next bar and vice versa.
When watching BTC:
If the value is high, the value of BTC is too high and should drop on the next bar and vice versa.
The Upper and Lowers are set at double the percentage fees on the exchange you use. This just helps in recognising beneficial trades.
BTC circulating supply [peregringlk]Just as simple as it sounds. The BTC circulating supply, deduced by using BTC_capitalization / BTCUSD.

Price CorrelationsThis indicator shows price correlations of your current chart to various well-known indices.
Values above 0 mean a positive correlation, below 0 a negative correlation (not correlated).
It works well with daily candle charts and above, but you may also try it on 1h candles.
The default indices:
- Gold
- S&p 500
- Mini Dow Jones
- Dow Jones
- Russel 2000
- Nasdaq 100
- Crude Oil
- Nikkei 225 (Japan)
- FTSE 100 (UK)
- Silver
- DAX Futures (DE)
You can change the defaults to compare prices with other indices or stocks.

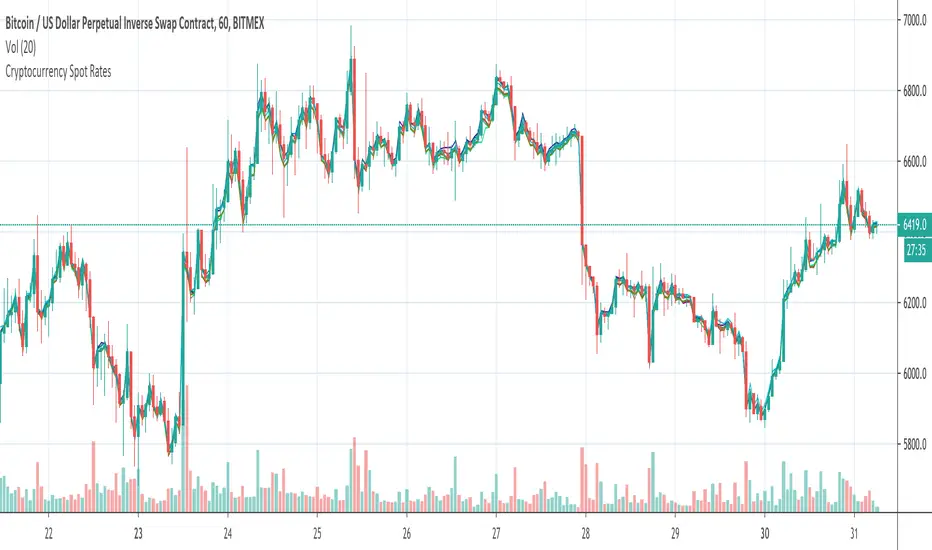
Cryptocurrency Spot RatesThis is an overlay indicator on the chart that will plot cryptocurrency spot prices of the following exchanges:
- Coinbase
- Poloniex
- OKCOIN
- Binance
- Huobi
- Bittrex
- HitBTC
- Kraken
- Bitfinex
Additionally it plots the price average of all those exchanges.
This overlay is intended to be used on charts with derivatives/futures such as BitMEX/Deribit/...
It works with all USD and Tether pairs on the main chart (for example BTCUSD, ETHUSD, BCHUSD,...)
USDT SupplyThis script shows the USDT (Tether) supply, total USDT market capitalization and USDT supply on various Cryptocurrency exchanges.
It is based on this script:
Changes:
- added HiTBTC and Huobi exchange
- updated to Pine Script v4
- improved default style and line width to highlight global USDT plots against exchange-specific plot lines

XBT % ContangoSimilar to my other indicators, but measures XBTUSD Contango in terms of percent.
Also, built it so you could change the values that give the red and green signals. Default values are 0% or less (backwardation) indicates green. However, i found that a 0.5% setting worked will finding local bottoms for current contract of XBTH20 (March 2020). The upper value default is at 5%, and signals red when the next contract reaches over 5%.
My assumption is as BTC increases in value over time, measuring contango in terms of percent will be a better measure of the XBT futures curve.
