Chanu Delta StrategyThis strategy is built on the Chanu Delta Indicator, which indicates the strength of the Bitcoin market. When the Chanu Delta Indicator hits “Delta_bull” and “Delta_bear” and closes the candle, long and short signals are triggered respectively. The example shown on the screen is a default setting optimized for a 4-hour candlestick strategy based on the Bybit BTCUSDT futures market. For the 15-minute candle, "Delta_bull=32", "Delta_bear=-31", "Source=hlc3" are best. You can use it by adjusting the setting value and modifying it to suit you.
If you use this strategy in conjunction with the Chanu Delta Indicator, it is convenient to anticipate alert signals in advance. Since the Chanu Delta Indicator represents the price difference based on the Bybit BTCUSDT futures market, backtesting is possible from March 2020.
Bitcoin (Mata Uang Crypto)

Chanu Delta IndicatorThe Chanu Delta Indicator was created as the price difference between the two markets using the principle that the Bitcoin price fluctuations in the BTCUSD market on the BYBIT exchange are greater in the BTCUSDT market. This indicator shows the strength of the current market's buys and sells, and helps in short-term trading.
Chanu Delta Indicator (Δ) = BTCUSD ($) - BTCUSDT ($) (Unit: Dollar, Source: Close)
● Δ > 100 : Strong Buy
● 20 < Δ < 100 : Buy
● -20 < Δ < 20 : Neutral
● -100 < Δ < -20 : Sell
● Δ < -100 : Strong Sell

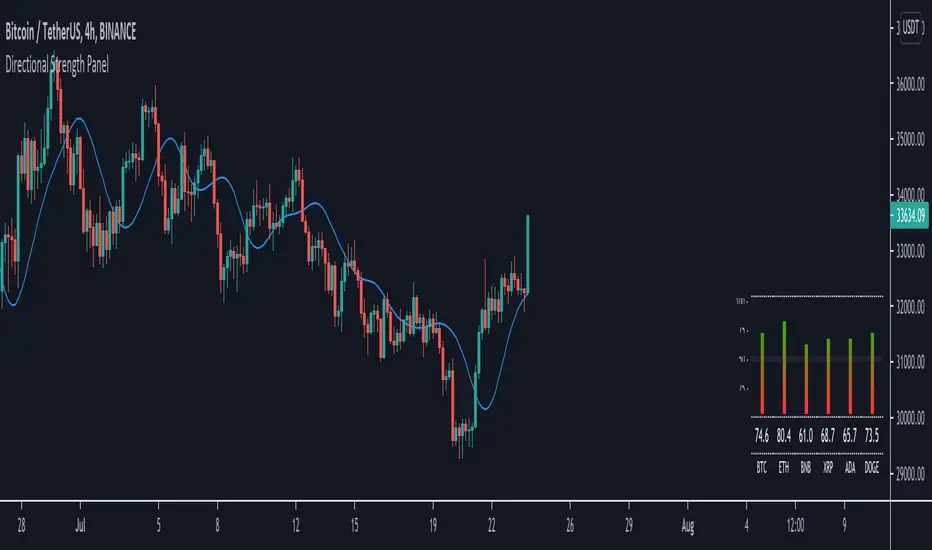
Directional Strength Panel█ OVERVIEW
The panel display trend momentum of selected coins/symbol (up to 6) based on the Arnaud Legoux Moving Average (ALMA). I'm using ALMA to measure the trend because it resolves 2 main issue of the more common moving averages, smoothing and responsiveness. By removing the minor fluctuations in price without sacrificing the responsiveness, the trend become much more clearer and easier to be measured.
In essence, as the meter approaches 100, it means the ALMA is pointing up (0 means pointing down)
█ Features
- Adjustable ALMA settings with options to turn on/off display the ALMA on current chart
- Select 6 symbols of your choice to be monitored in the settings (You have to manually update the label to display)
- Working on all timeframes
- Switch the panel color to suit background chart theme (Light/Dark)
█ Developer Notes
I'm working with table a lot lately and decided to publish this as a sample if anyone wishes to edit the script to display whatever they want. main calculation in get_data() function should be clamped to value between 0-100. As for the panel size, you can edit the row_max (currently set to 20 and 40) if you need it to be smaller or bigger (**i feel anything smaller than 16 is ugly)
█ Disclaimer
Past performance is not an indicator of future results.
My opinions and research are my own and do not constitute financial advice in any way whatsoever.
Nothing published by me constitutes an investment recommendation, nor should any data or Content published by me be relied upon for any investment/trading activities.
I strongly recommends that you perform your own independent research and/or speak with a qualified investment professional before making any financial decisions.
Any ideas to further improve this indicator are welcome :)
3x EMA fast, 3 x MA slow + BB + PsarThis is a trend system which combines multiple fast EMA + mulitple slower SMA together with bollinger band channel and PSAR.
For entry rules the ones that I use are:
Long
We are inside BB channel, psar is ascending, and our close is above all moving averages or below all EMA'S + 1 SMA
WE can exit either when our close is below all EMA's or when PSAR is descending or when we hit upper/lower BB levels
Short
We are inside BB channel, psar is descnending, and our close is below all moving averages or below all EMA's + 1 SMA
WE can exit either when our close is above all EMA's or when PSAR is ascending or when we hit upper/lower BB levels
If you have any questions, let me know

Aggregated Volume Colored (Bitcoin, ETH, Altcoins, everything)BITSTAMP:BTCUSD
This indicator aggregates trading volume data of up to 10 symbols and can display the individual data by color.
It is useful for assets which are traded on multiple exchanges, like cryptocurrencies, commodities, forex and derivatives showing you what is happening across the market and on the individual exchanges to give you beter insights.
You can change the symbols from which the indicator gathers data in the settings under inputs, just like the colors, and you can add a moving average.
By default trading volume is aggregated from the following symbols:
Binance, BTC /USDT
Binance, BTC /BUSD
Bingbon, BTC /USD
Huobi, BTC /USDT
OkeX, BTC /USDT
Coinbase, BTC /USD
Bitfinex, BTC /USD
Gemini, BTC /USD
Kraken, XBT/USD
Bitstamp, BTC /USD

Compare Crypto Bollinger Bands//This is not financial advice, I am not a financial advisor.
//What are volatility tokens?
//Volatility tokens are ERC-20 tokens that aim to track the implied volatility of crypto markets.
//Volatility tokens get their exposure to an asset’s implied volatility using FTX MOVE contracts.
//There are currently two volatility tokens: BVOL and IBVOL.
//BVOL targets tracking the daily returns of being 1x long the implied volatility of BTC
//IBVOL targets tracking the daily returns of being 1x short the implied volatility of BTC.
/////////////////////////////////////////////////////////////////
CAN USE ON ANY CRYPTO CHART AS BINANCE:BTCUSD is still the most dominant crypto, positive volatility for BTC is positive for all.
/////////////////////////////////////////////////////////////////
//The Code.
//The blue line (ChartLine) is the current chart plotted on in Bollinger
//The red line (BVOLLine) plots the implied volatility of BTC
//The green line (IBVOLLine) plot the inverse implied volatility of BTC
//The orange line (TOTALLine) plots how well the crypto market is performing on the Bolling scale. The higher the number the better.
//There are 2 horizontal lines, 0.40 at the bottom & 0.60 at the top
/////////To Buy
//1. The blue line (ChartLine) must be higher than the green line (IBVOLLine)
//2. The green line (IBVOLLine) must be higher than the red line (BVOLLine)
//3. The red line (BVOLLine) must be less than 0.40 // This also acts as a trendsetter
//4. The orange line (TOTALLine) MUST be greater than the red line. This means that the crypto market is positive.
//5.IF THE BLUE LINE (ChartLine) IS GREATER THAN THE ORANGE LINE (TOTALLine) IT MEANS YOUR CRYPTO IS OUTPERFOMING THE MARKET {good for short term explosive bars}
//6. If the orange line (TOTALLine) is higher than your current chart, say BTCUSD. And BTC is going up to. It just means BTC is going up slowly. it's fine as long as they are moving in the same position.
//5. I use this on the 4hr, 1D, 1W timeframes
///////To Exit
//1.If the blue line (ChartLine) crosses under the green line (IBVOLLine) exit{ works best on 4hr,1D, 1W to avoid fakes}
//2.If the red line crosses over the green line when long. {close positions, or watch positions} It means negative volatility is wining

Multi-X by HamidBoxHello to All, introducing Multi Types Crossover strategy,
simply the best way of trading with Crossover and Crossunder Strategy, How it Works???
I added 5 types of Moving Averages,
1: Simple Moving Average ( SMA )
2: Exponential Moving Average ( EMA )
3: Weighted Moving Average ( WMA )
4: Volume Weighted Moving Average ( VWMA )
5: Relative Moving Average (RMA)
With this indicator, you can do scalping, You can trade not only with similar types of Moving Average indicators but also with different types of Moving Average indicators.
what is mean? like: Normal Condition is:
( Simple Moving Average ) Crossover to ( Simple Moving Average ), SMA x SMA
( Exponential Moving Average ) Crossover to ( Exponential Moving Average ), EMA x EMA
But we can Crossover with:
( Exponential Moving Average ) Crossover to ( Simple Moving Average ), EMA x SMA
( Simple Moving Average ) Crossover to ( Weighted Moving Average ), SMA x WMA
( Weighted Moving Average ) Crossover to ( Weighted Moving Average ), WMA x WMA
( Simple Moving Average ) Crossover to (Relative Moving Average), WMA x RMA
and also I added Moving Average ZONE in this tool, What does it work???
The zone will tell us what type of direction the market has, if the market is above the zone, it's mean we have a Bullish Trend, and if the market is below the zone, it means the market has a Bearish Trend,
so if you want to play on the safe side, never trade when the market is in Bearish Trend, and if you want to play on aggressive mood, you can skip Moving Average Zone section.

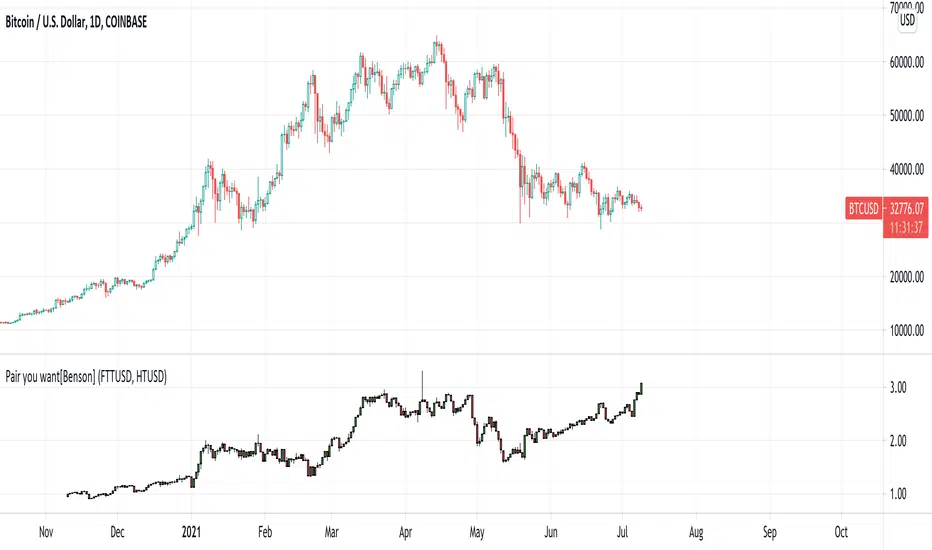
Pair you want[Benson]Create your own crypto pair to see the relative price movement between 2 coins.
This indicator is a good reference tool to do hedge trading.
Users can enter the exchange and ticker name they like.
Bubble indicatorA simple and accurate indicator that signals the end of the Bitcoin's bull run. This indicator is an inverted lower Bollinger band , taken from a weekly chart. An interesting observation led to the creation of this indicator: on the weekly chart the lower band takes negative values (the red zone in the indicator) at the end of the Bitcoin's bull run. The advantage of this indicator is that the signal comes in advance.

SWING for GOLD / BITCOIN Hey everyone
I want to share my swing trading system with you.Based on two moving averages coupled to RSI
The options
Shows current trends and entries for trades. Average trade retention 15-20 days
Entries for trades with a crossover of two lines
The percentage of successful test deals XAU/USD for 2010-2021: 69%

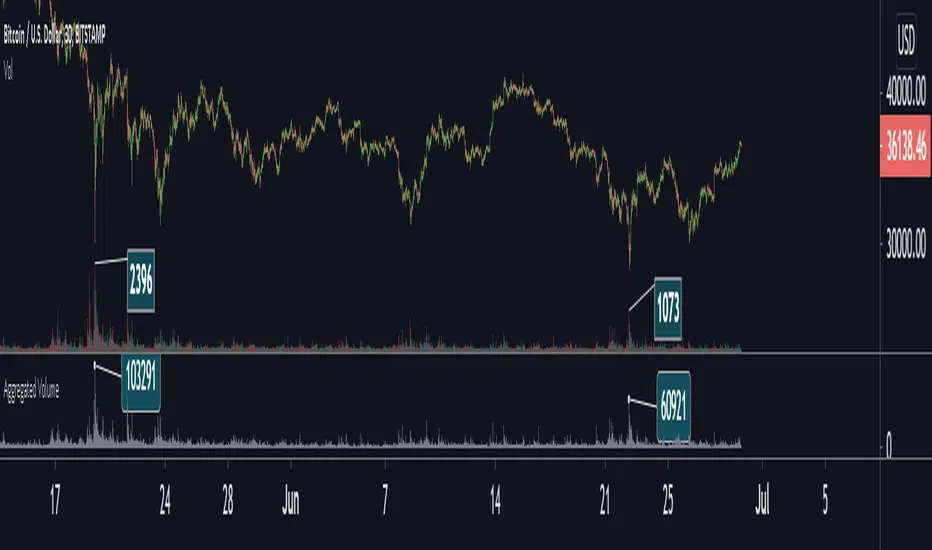
Aggregated VolumeBITSTAMP:BTCUSD
This indicator aggregates trading volume data of assets which are traded on multiple exchanges (like cryptocurrencies, commodities, forex and derivatives) to give you better insights on the markets.
You can change the markets from which the indicator gathers data in the settings under inputs.
By default, data is aggregated from the following markets:
Binance, BTC /USDT
Binance, BTC /BUSD
Bitfinex, BTC /USD
Coinbase, BTC /USD
Bingbon, BTC /USD
Bitstamp , BTC /USD
Kraken, XBT/USD
Gemini, BTC /USD
OkeX, BTC /USDT
Huobi, BTC /USDT
Ichimoku Cloud Strategy Long Only [Bitduke]Slightly modificated and optimized for Pine Script 4.0, Ichimoku Cloud Strategy which, suddenly, good suitable for the several crypto assets.
Details:
Enter position when conversion line crosses base line up, and close it when the opposite happens.
Additional condition for open / close the trade is lagging span, it should be higher than cloud to open position and below - to close it.
Backtesting:
Backtested on SOLUSDT ( FTX, Binance )
+150% for 2021 year, 8% dd
+191% for all time, 32% dd
Disadvantages:
- Small number of trades
- Need to vary parameters for different coins (not very robust)
Should be tested carefully for other coins / stock market. Different parameters could be needed or even algo modifications.
Strategy doesn't repaint.

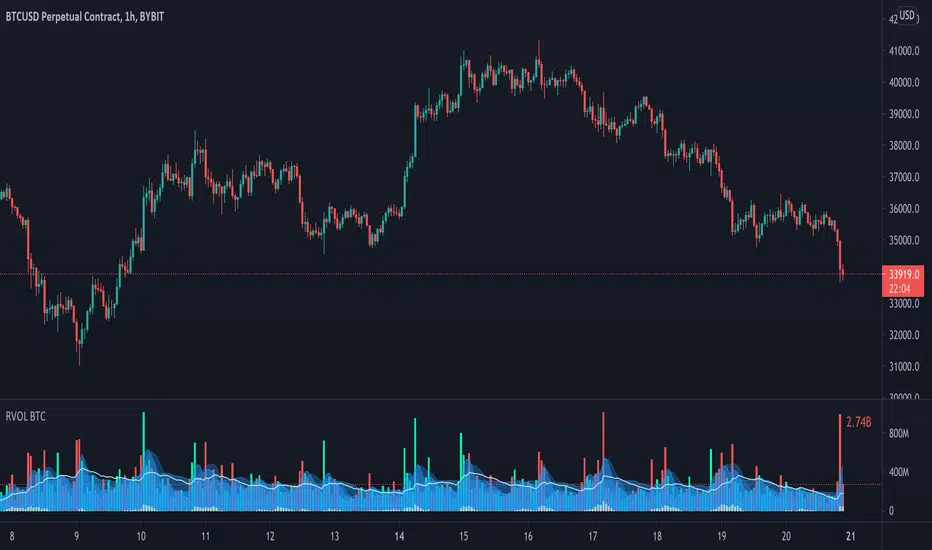
Relative Volume - BITCOINRelative Volume indicator that pulls data from 9 different Bitcoin exchanges. Please note that this indicator only works with BTC and will not use data from your current chart.
Includes the following exchanges:
BYBIT:BTCUSD
BITFINEX:BTCUSD
BITSTAMP:BTCUSD
INDEX:BTCUSD
COINBASE:BTCUSD
FTX:BTCUSD
PHEMEX:BTCUSD
BITTREX:BTCUSD
POLONIEX:BTCUSDT
Wide BarsSimple scripts show the wide range bars within in the look back period, visualizing the bigger momentum.
Added four exponential moving averages which define the trend of the instrument.
Wide range candles in the direction of overall trend on higher timeframes; give confluence of higher participation in the same direction.
Note : Decent volume above the average volume with wide range candle adds more value.

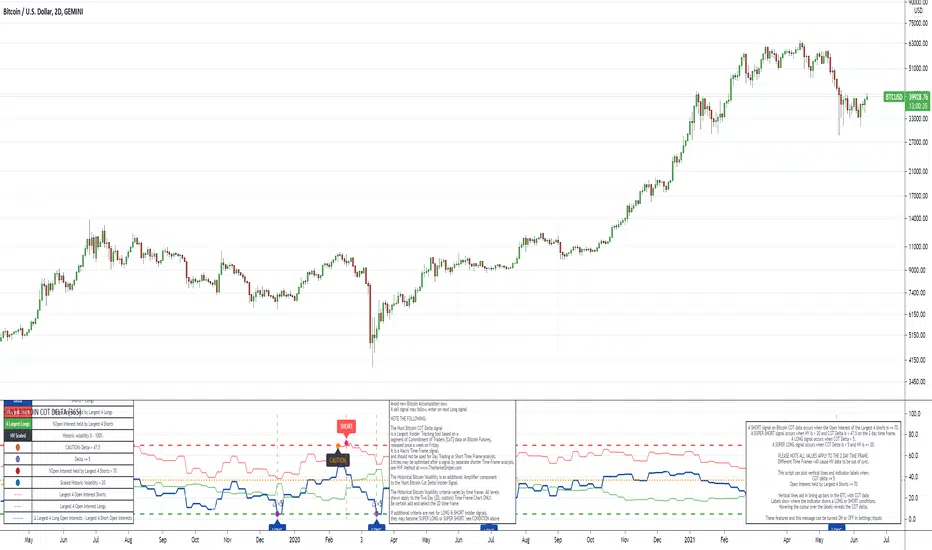
The Signal - Hunt Bitcoin CoT Buy/SellThe Signal - Hunt Bitcoin CoT Buy/Sell
Why Bother with another CoT signal?
Its different & focused on the Insider's. The Largest 4 Open Interest Seller and the Largest 4 open Interest Longs, plus the distance they are apart, the Delta, what does high percentage of Largest 4 sellers mean with a low 4 OI Buyers. , what when the usually higher Sellers are low and the largest 4 buyers almost the same value , Time to track the insiders Delta..
Performance -
This Indicator provided a
1. Signal 1 = 26th March 2019 = SUPER LONG at $4,500 that saw a near $14,000 run up
2. Signal 2 = 18th & 24th June 2019 = SHORT at the second & final level $11,700 after repeated attempts & failure in the $13K range, the mini Echo Bitcoin Bull of 2019
3. Signal 3 = 17th December 2019 = LONG $6,900, Bitcoin rallied to Mid $10,500's
4. Signal 4 = 18th Feb 2020 = SUPER SHORT from $9,700's to a final extreme Low of $3,000, calling the CV-19 collapse
5. Signal 5 = 17th March 2020 = LONG from $5,400 no closure point yet
6. Signal 6 = 29th June 2020 = SUPER LONG reiterate from $10,700 no closure sell signal yet
7. Signal 7 = 17th May 2020 = LONG another accumulate LONG with no sell signal yet generated at Post H&S's low of $33,000
Note - This indicator only commences March 2019, as Bitcoin futures were a recent introduction and needed to settle for 6 months in both use and data, no signals were meaningful prior & data was light.
What is Provided. - Please note the need to also add the Hunt Bitcoin Historical Volatility Indicator for full understanding.
We provide 3 things with the 3 indicators.
'Insider' indications from Largest players in the futures market.
1. Bitcoin Macro Buy Signals.
a) The Bitcoin Commitment of Traders results see us focus solely on Largest 4 Short Open Interest & Largest 4 Long Open Interest aspects of the CoT Release data.
When the difference - is tight, a kind of pinch, these have been great Buy signals in Bitcoin.
We call this difference the Delta & When Delta is 5% or less Bitcoin is a Buy.
2. Bitcoin Macro Sells.
a) A sell signal is Triggered in Bitcoin at any point the Largest 4 short OI > or = to 70
3. AMPLIFIER Trade signals 'Super' Longs or Shorts -
Extreme low volatility events leads to highly impulsive & volatile subsequent moves, if either of 1 or 2 above occur, combined with extreme low volatility
a 'Super Long' or 'SUPER SELL' is generated. In the case of the short side, given Bitcoins general expansive and MACRO Bull trend since inception, we seek an additional component
that is an extreme differential/Delta reading between 4 biggest Longs & Shorts OI.
Namely CoT Delta also must be > 47.5%
We also have a Cautionary level, where it is not necessarily a good idea to accumulate Bitcon, as a better opportunity lower may avail itself, see conditions below.
So the required logic explicitly stated below for all Signals.
1. Long - Hunt Bitcoin CoT Delta < or = 5
2. SUPER Long - Hunt Bitcoin CoT Delta < or = 5; and 2 Day Historical Bitcoin Volatility = or < 20
3. Short - Largest 4 Sellers OI = or > 70
4. SUPER Short - Largest 4 Sellers OI = or > 70; AND..
Hunt Bitcoin CoT Delta = or > 47.5 AND 2 Day Historical BTC Volatility = or < 20
5. Caution - Largest 4 Sellers OI = or > 67.5 AND Hunt Bitcoin CoT Delta = or > 45
WARNING SEE Notes Below
Note 1 - = Largest 4 Open Interest Shorts
Note 2 - = Largest 4 Open Interest Longs
Note 3 - = Hunt Cot Delta = (Largest 4 sellers OI) -( Largest 4 Buyers OI)
Caution = Avoid new Bitcoin Accumulation Right Now, A sell signal might follow Enter on next Long
Note 4 - The Hunt Bitcoin COT Delta signal is a Largest 'Insider' Tracking tool based on a segment of Commitment of Traders data on Bitcoin Futures, released once a week on a Friday.
It is a Macro Timeframe signal , and should not be used for Day trading and Short Timeframe analysis , Entries may be optimised after a Hunt Bitcoin CoT Signal is generated by separate shorter Timeframe analysis.
Note 5 - The Historical Bitcoin Volatility is an additional 'Amplifier' component to the 'Hunt Bitcoin Cot Delta' Insider Signal
Note 6 - The Historical Bitcoin Volatility criteria varies by timeframe, the above levels are those applying on a Two Day TF Chart, select this custom timeframe in Trading View.
if additional criteria are met for LONG & SHORT insider signals, they may become 'Super Longs/Shorts', see conditions box above.

The Amplifier - Two Day Historical Bitcoin Volatility PlotThe 3rd piece to the other two pieces to our CoT study. This is the Amplifier, which turns select signals into 'Super' Buys/Sells
The other two being the 'Bitcoin Insider CoT Delta', and the on chart Price indicator most will have, if no others the 'Hunt Bitcoin CoT Buy/Sell Signals' that will indicate the key signals, ave 4 a year on the chart as they occur.
Why Bother another CoT signal?
Its different & focused on the Insider's.
Performance -
This Indicator provided a
1. Signal 1 = 26th March 2019 = SUPER LONG at $4,500 that saw a near $14,000 run up
2. Signal 2 = 18th & 24th June 2019 = SHORT at the second & final level $11,700 after repeated attempts & failure in the $13K range, the mini Echo Bitcoin Bull of 2019
3. Signal 3 = 17th December 2019 = LONG $6,900, Bitcoin rallied to Mid $10,500's
4. Signal 4 = 18th Feb 2020 = SUPER SHORT from $9,700's to a final extreme Low of $3,000, calling the CV-19 collapse
5. Signal 5 = 17th March 2020 = LONG from $5,400 no closure point yet
6. Signal 6 = 29th June 2020 = SUPER LONG reiterate from $10,700 no closure sell signal yet
7. Signal 7 = 17th May 2020 = LONG another accumulate LONG with no sell signal yet generated at Post H&S's low of $33,000
Note - This indicator only commences March 2019, as Bitcoin futures were a recent introduction and needed to settle for 6 months in both use and data, no signals were meaningful prior & data was light.
What is Provided. - Please note the need to also add the Hunt Bitcoin Historical Volatility Indicator for full understanding.
We provide 3 things with the 3 indicators.
'Insider' indications from Largest players in the futures market.
1. Bitcoin Macro Buy Signals.
a) The Bitcoin Commitment of Traders results see us focus solely on Largest 4 Short Open Interest & Largest 4 Long Open Interest aspects of the CoT Release data.
When the difference - is tight, a kind of pinch, these have been great Buy signals in Bitcoin.
We call this difference the Delta & When Delta is 5% or less Bitcoin is a Buy.
2. Bitcoin Macro Sells.
a) A sell signal is Triggered in Bitcoin at any point the Largest 4 short OI > or = to 70
3. AMPLIFIER Trade signals 'Super' Longs or Shorts -
Extreme low volatility events leads to highly impulsive & volatile subsequent moves, if either of 1 or 2 above occur, combined with extreme low volatility
a 'Super Long' or 'SUPER SELL' is generated. In the case of the short side, given Bitcoins general expansive and MACRO Bull trend since inception, we seek an additional component
that is an extreme differential/Delta reading between 4 biggest Longs & Shorts OI.
Namely CoT Delta also must be > 47.5%
We also have a Cautionary level, where it is not necessarily a good idea to accumulate Bitcon, as a better opportunity lower may avail itself, see conditions below.
So the required logic explicitly stated below for all Signals.
1. Long - Hunt Bitcoin CoT Delta < or = 5
2. SUPER Long - Hunt Bitcoin CoT Delta < or = 5; and 2 Day Historical Bitcoin Volatility = or < 20
3. Short - Largest 4 Sellers OI = or > 70
4. SUPER Short - Largest 4 Sellers OI = or > 70; AND..
Hunt Bitcoin CoT Delta = or > 47.5 AND 2 Day Historical BTC Volatility = or < 20
5. Caution - Largest 4 Sellers OI = or > 67.5 AND Hunt Bitcoin CoT Delta = or > 45
WARNING SEE Notes Below
Note 1 - = Largest 4 Open Interest Shorts
Note 2 - = Largest 4 Open Interest Longs
Note 3 - = Hunt Cot Delta = (Largest 4 sellers OI) -( Largest 4 Buyers OI)
Caution = Avoid new Bitcoin Accumulation Right Now, A sell signal might follow Enter on next Long
Note 4 - The Hunt Bitcoin COT Delta signal is a Largest 'Insider' Tracking tool based on a segment of Commitment of Traders data on Bitcoin Futures, released once a week on a Friday.
It is a Macro Timeframe signal , and should not be used for Day trading and Short Timeframe analysis , Entries may be optimised after a Hunt Bitcoin CoT Signal is generated by separate shorter Timeframe analysis.
Note 5 - The Historical Bitcoin Volatility is an additional 'Amplifier' component to the 'Hunt Bitcoin Cot Delta' Insider Signal
Note 6 - The Historical Bitcoin Volatility criteria varies by timeframe, the above levels are those applying on a Two Day TF Chart, select this custom timeframe in Trading View.
if additional criteria are met for LONG & SHORT insider signals, they may become 'Super Longs/Shorts', see conditions box above.

Low Timeframe POCI have recently made a High Timeframe POC script (HFT POC) which is pretty popular. Thanks for this!
There are many requests to include lower timeframes in this script, that is why I created this script. I could have incorporated all the timeframe POC's into one indicator but I went this route to keep things more organized between all the different timeframes.
Currently included: Daily, 6H, 3H and 1H
/* DEFINITION */
Point Of Control (= POC) is a price level at which the heaviest volumes were traded.
/* HOW TO TRADE WITH THIS INDICATOR */
The basis for POC is determining bias on whichever timeframe you choose.
1. Identify a POC on the timeframe of your choosing.
/* If you choose the lowest timeframe (1H here) then always make sure to look at the higher timeframes to see how it is trading against a HTF POC.
2. When the price is moving away from the POC (either to the upside or downside) this can confirm or invalidate a trade.
3. You can now enter the trade on bias or wait for a retest of the same POC.
/* EXAMPLE TRADES /*
Here is a screenshot of some of the trades that are possible using these Low Timeframe POC's and some common sense.
s3.tradingview.com

Hunt Bitcoin CoT Buy/Sell signalWhy Bother another CoT signal?
Its different & focused on the Insider's.
Performance -
This Indicator provided a
1. Signal 1 = 26th March 2019 = SUPER LONG at $4,500 that saw a near $14,000 run up
2. Signal 2 = 18th & 24th June 2019 = SHORT at the second & final level $11,700 after repeated attempts & failure in the $13K range, the mini Echo Bitcoin Bull of 2019
3. Signal 3 = 17th December 2019 = LONG $6,900, Bitcoin rallied to Mid $10,500's
4. Signal 4 = 18th Feb 2020 = SUPER SHORT from $9,700's to a final extreme Low of $3,000, calling the CV-19 collapse
5. Signal 5 = 17th March 2020 = LONG from $5,400 no closure point yet
6. Signal 6 = 29th June 2020 = SUPER LONG reiterate from $10,700 no closure sell signal yet
7. Signal 7 = 17th May 2020 = LONG another accumulate LONG with no sell signal yet generated at Post H&S's low of $33,000
Note - This indicator only commences March 2019, as Bitcoin futures were a recent introduction and needed to settle for 6 months in both use and data, no signals were meaningful prior & data was light.
What is Provided. - Please note the need to also add the Hunt Bitcoin Historical Volatility Indicator for full understanding.
We provide 3 things with the 3 indicators.
'Insider' indications from Largest players in the futures market.
1. Bitcoin Macro Buy Signals.
a) The Bitcoin Commitment of Traders results see us focus solely on Largest 4 Short Open Interest & Largest 4 Long Open Interest aspects of the CoT Release data.
When the difference - is tight, a kind of pinch, these have been great Buy signals in Bitcoin.
We call this difference the Delta & When Delta is 5% or less Bitcoin is a Buy.
2. Bitcoin Macro Sells.
a) A sell signal is Triggered in Bitcoin at any point the Largest 4 short OI > or = to 70
3. AMPLIFIER Trade signals 'Super' Longs or Shorts -
Extreme low volatility events leads to highly impulsive & volatile subsequent moves, if either of 1 or 2 above occur, combined with extreme low volatility
a 'Super Long' or 'SUPER SELL' is generated. In the case of the short side, given Bitcoins general expansive and MACRO Bull trend since inception, we seek an additional component
that is an extreme differential/Delta reading between 4 biggest Longs & Shorts OI.
Namely CoT Delta also must be > 47.5%
We also have a Cautionary level, where it is not necessarily a good idea to accumulate Bitcon, as a better opportunity lower may avail itself, see conditions below.
So the required logic explicitly stated below for all Signals.
1. Long - Hunt Bitcoin CoT Delta < or = 5
2. SUPER Long - Hunt Bitcoin CoT Delta < or = 5; and 2 Day Historical Bitcoin Volatility = or < 20
3. Short - Largest 4 Sellers OI = or > 70
4. SUPER Short - Largest 4 Sellers OI = or > 70; AND..
Hunt Bitcoin CoT Delta = or > 47.5 AND 2 Day Historical BTC Volatility = or < 20
5. Caution - Largest 4 Sellers OI = or > 67.5 AND Hunt Bitcoin CoT Delta = or > 45
WARNING SEE Notes Below
Note 1 - = Largest 4 Open Interest Shorts
Note 2 - = Largest 4 Open Interest Longs
Note 3 - = Hunt Cot Delta = (Largest 4 sellers OI) -( Largest 4 Buyers OI)
Caution = Avoid new Bitcoin Accumulation Right Now, A sell signal might follow Enter on next Long
Note 4 - The Hunt Bitcoin COT Delta signal is a Largest 'Insider' Tracking tool based on a segment of Commitment of Traders data on Bitcoin Futures, released once a week on a Friday.
It is a Macro Timeframe signal , and should not be used for Day trading and Short Timeframe analysis , Entries may be optimised after a Hunt Bitcoin CoT Signal is generated by separate shorter Timeframe analysis.
Note 5 - The Historical Bitcoin Volatility is an additional 'Amplifier' component to the 'Hunt Bitcoin Cot Delta' Insider Signal
Note 6 - The Historical Bitcoin Volatility criteria varies by timeframe, the above levels are those applying on a Two Day TF Chart, select this custom timeframe in Trading View.
if additional criteria are met for LONG & SHORT insider signals, they may become 'Super Longs/Shorts', see conditions box above.

Hunt Bitcoin CoT Open Interest DeltaWhy Bother another CoT signal?
Its different & focused on the Insider's.
Performance -
This Indicator provided a
1. Signal 1 = 26th March 2019 = SUPER LONG at $4,500 that saw a near $14,000 run up
2. Signal 2 = 18th & 24th June 2019 = SHORT at the second & final level $11,700 after repeated attempts & failure in the $13K range, the mini Echo Bitcoin Bull of 2019
3. Signal 3 = 17th December 2019 = LONG $6,900, Bitcoin rallied to Mid $10,500's
4. Signal 4 = 18th Feb 2020 = SUPER SHORT from $9,700's to a final extreme Low of $3,000, calling the CV-19 collapse
5. Signal 5 = 17th March 2020 = LONG from $5,400 no closure point yet
6. Signal 6 = 29th June 2020 = SUPER LONG reiterate from $10,700 no closure sell signal yet
7. Signal 7 = 17th May 2020 = LONG another accumulate LONG with no sell signal yet generated at Post H&S's low of $33,000
Note - This indicator only commences March 2019, as Bitcoin futures were a recent introduction and needed to settle for 6 months in both use and data, no signals were meaningful prior & data was light.
What is Provided. - Please note the need to also add the Hunt Bitcoin Historical Volatility Indicator for full understanding.
We provide 3 things with the 3 indicators.
'Insider' indications from Largest players in the futures market.
1. Bitcoin Macro Buy Signals.
a) The Bitcoin Commitment of Traders results see us focus solely on Largest 4 Short Open Interest & Largest 4 Long Open Interest aspects of the CoT Release data.
When the difference - is tight, a kind of pinch, these have been great Buy signals in Bitcoin.
We call this difference the Delta & When Delta is 5% or less Bitcoin is a Buy.
2. Bitcoin Macro Sells.
a) A sell signal is Triggered in Bitcoin at any point the Largest 4 short OI > or = to 70
3. AMPLIFIER Trade signals 'Super' Longs or Shorts -
Extreme low volatility events leads to highly impulsive & volatile subsequent moves, if either of 1 or 2 above occur, combined with extreme low volatility
a 'Super Long' or 'SUPER SELL' is generated. In the case of the short side, given Bitcoins general expansive and MACRO Bull trend since inception, we seek an additional component
that is an extreme differential/Delta reading between 4 biggest Longs & Shorts OI.
Namely CoT Delta also must be > 47.5%
We also have a Cautionary level, where it is not necessarily a good idea to accumulate Bitcon, as a better opportunity lower may avail itself, see conditions below.
So the required logic explicitly stated below for all Signals.
1. Long - Hunt Bitcoin CoT Delta < or = 5
2. SUPER Long - Hunt Bitcoin CoT Delta < or = 5; and 2 Day Historical Bitcoin Volatility = or < 20
3. Short - Largest 4 Sellers OI = or > 70
4. SUPER Short - Largest 4 Sellers OI = or > 70; AND..
Hunt Bitcoin CoT Delta = or > 47.5 AND 2 Day Historical BTC Volatility = or < 20
5. Caution - Largest 4 Sellers OI = or > 67.5 AND Hunt Bitcoin CoT Delta = or > 45
WARNING SEE Notes Below
Note 1 - = Largest 4 Open Interest Shorts
Note 2 - = Largest 4 Open Interest Longs
Note 3 - = Hunt Cot Delta = (Largest 4 sellers OI) -( Largest 4 Buyers OI)
Caution = Avoid new Bitcoin Accumulation Right Now, A sell signal might follow Enter on next Long
Note 4 - The Hunt Bitcoin COT Delta signal is a Largest 'Insider' Tracking tool based on a segment of Commitment of Traders data on Bitcoin Futures, released once a week on a Friday.
It is a Macro Timeframe signal , and should not be used for Day trading and Short Timeframe analysis , Entries may be optimised after a Hunt Bitcoin CoT Signal is generated by separate shorter Timeframe analysis.
Note 5 - The Historical Bitcoin Volatility is an additional 'Amplifier' component to the 'Hunt Bitcoin Cot Delta' Insider Signal
Note 6 - The Historical Bitcoin Volatility criteria varies by timeframe, the above levels are those applying on a Two Day TF Chart, select this custom timeframe in Trading View.
if additional criteria are met for LONG & SHORT insider signals, they may become 'Super Longs/Shorts', see conditions box above.
[RickAtw] ZONE Trend 3█ OVERVIEW
This indicator tracks current trends. Trends are determined by the zones created for them, the brighter the zone, the higher the probability of a market reversal.
█ FEATURES
The indicator adapts to any market.
You can set your own values for your system
Any timeframe can be used
You can increase the number of zones
█ HOW TO USE
If the market starts to enter the red zone, open buy and hold until the second or third zone.
If the market moves towards the blue zone, we sells and hold until the next zone.
█ The author of the work
Rick Atwood
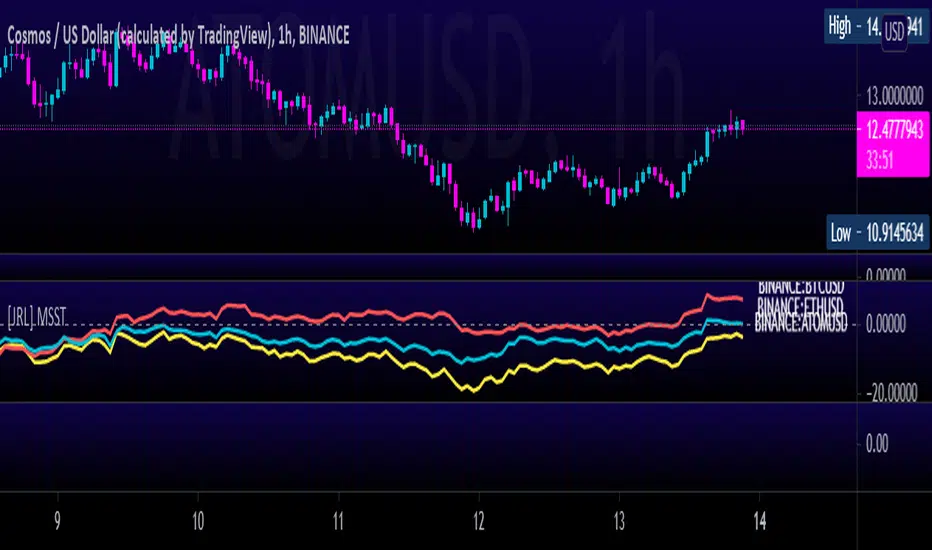
[JRL] Multi-Symbol Strength TrackerI created this script to compare cryptocurrencies that tend to be correlated, but it could also be used for forex or any other market. It is a fairly simple concept and compares price of each symbol to the specified period ema. This is helpful for tracking highly correlated symbols and visualizing moments when they are out of sync, perhaps signaling good times for buying or selling.
Mayer Multiple RainbowUses a more recent sampling (since 2013) to generated Mayer Multiple distribution.

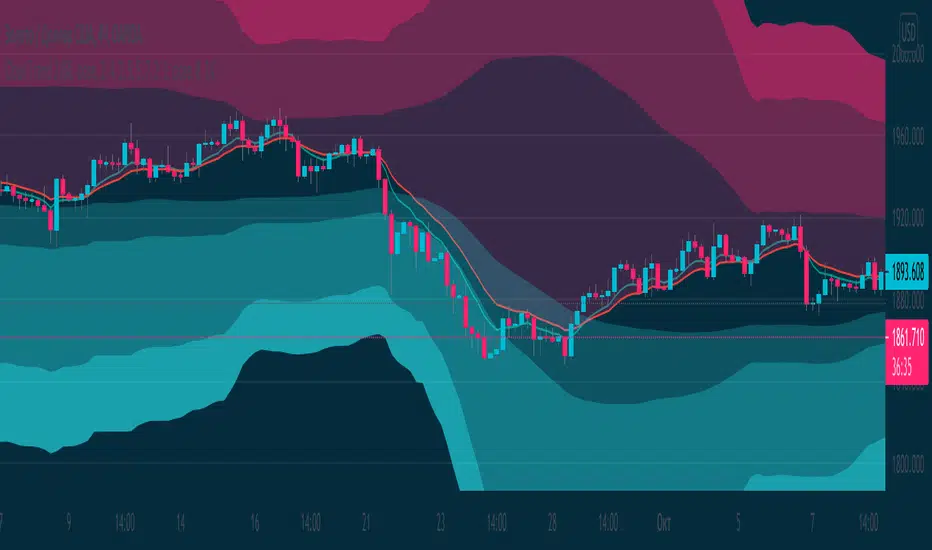
Awesome Heikin Ashi [Morty]This indicator uses Heikin Ashi candles and two EMAs to help you follow the trend and enter the trade. Heikin Ashi candles help to smooth the price and EMAs are used to detect trend. The default parameter of EMA is EMA10 and EMA20. You can use it at any timeframe. You should always adjust the EMA length according to different timeframes.
Features:
- Highlight background based on two EMAs
- Adjustable EMA length
- Adjustable Label size
- Show entry and exit signal labels
- Show stoploss price
- You can choose Long only or Short only or both signals
- Alert functions for notification
NOTE: If you use this signal to enter a trade, make sure the candle is close and enter in the next candle.
