CRS by TQCRS by TradeQUO
Comparative Relative Strength Indicator
What it does
Computes the percentage difference in performance between your current chart symbol (e.g. GC1!) and a chosen benchmark (e.g. ES1!, DXY, NQ1!).
Smooths that “CRS” line with a configurable moving average (SMA, EMA, WMA) — default length is 63 bars.
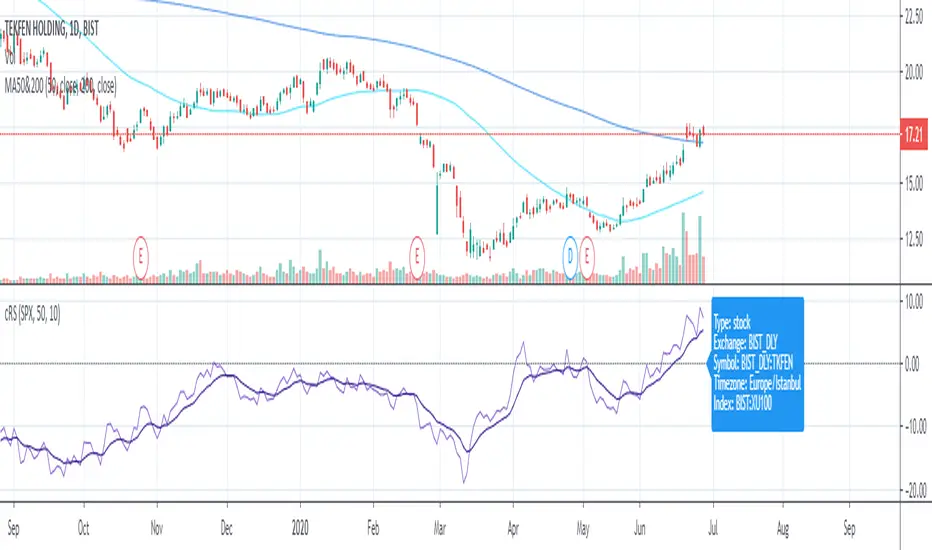
Key Plots
CRS (%) (aqua) — how your symbol has held up relative to the benchmark since the chart loaded.
CRS MA (%) (fuchsia) — smoothed trend of that relative strength.
How to Interpret
Trend-Following
Long when CRS crosses above its MA and is above 0 → your symbol is outperforming.
Short (or reverse) when CRS crosses below its MA and is below 0 → underperformance.
Regime Filter
CRS > 0 → Risk-On environment for your symbol vs. benchmark.
CRS < 0 → Risk-Off relative to the benchmark.
Divergence Signals
Bearish Divergence: Price makes a higher high, but CRS makes a lower high → potential sell-off incoming.
Bullish Divergence: Price makes a lower low, but CRS makes a higher low → look for rebound opportunity.
Pairs Trading
Outperformance: Long your symbol + Short benchmark when CRS > MA.
Underperformance: Short your symbol + Long benchmark when CRS < MA.
Why it matters
Reveals relative market leadership early, not just absolute price moves.
Helps you allocate risk dynamically, spot rotations and catch reversals before they show in price alone.