Institutional Zones: Opening & Closing Trend HighlightsDescription / Content:
Track key institutional trading periods on Nifty/Bank Nifty charts with dynamic session zones:
Opening Volatility Zone: 9:15 AM – 9:45 AM IST (Green)
Closing Institutional Zone: 1:30 PM – 3:30 PM IST (Orange)
Both zones are bounded by the day’s high and low to help visualize institutional activity and price behavior.
Key Observations:
Breakout in both closing trend and opening trends often occurs on uptrending days.
Breakdown in both closing range and opening range usually happens on downside trending days.
Price opening above the previous closing trend is often a sign of a strong opening.
This script helps traders identify trend strength, breakout/breakdown zones, and institutional participation during critical market hours.
Disclaimer:
This indicator is for educational and informational purposes only. It is not a financial advice or recommendation to buy or sell any instrument. Always confirm with your own analysis before taking any trade.
Pine Script Features:
Dynamic boxes for opening and closing sessions
Boxes adjust to the day’s high and low
Optional labels at session start
Works on intraday charts (1m, 5m, 15m, etc.)
Usage Tip:
Use this indicator in combination with trend analysis and volume data to spot strong breakout/breakdown opportunities in Nifty and Bank Nifty.
Bankniftytrend

Relative volume zone + Smart Order Flow Dynamic S/ROverview:
The Relative Volume Zone + Smart Order Flow with Dynamic S/R indicator is designed to help traders identify key trading opportunities by combining multiple technical components. This script integrates relative volume analysis, order flow detection, VWAP, RSI filtering, and dynamic support and resistance levels to offer a comprehensive view of the market conditions. It is particularly effective on shorter timeframes (M5, M15), making it suitable for scalping and day trading strategies.
Key Components:
1. Relative Volume Zones:
• The script calculates the relative volume by comparing the current volume with the average volume over a defined lookback period (volLookback). When the relative volume exceeds a specified multiplier (volMultiplier), it indicates a high volume zone, signaling potential accumulation or distribution areas.
• Purpose: Identifies high-volume trading zones that may act as significant support or resistance, indicating possible entry or exit points.
2. Smart Order Flow Analysis:
• The indicator uses Volume Delta (the difference between buying and selling volume) and a Cumulative Delta to detect order imbalances in the market.
• Order Imbalance is identified using a moving average of the Volume Delta (orderImbalance), which helps highlight hidden buying or selling pressure.
• Purpose: Reveals market sentiment by showing whether buyers or sellers dominate the market, aiding in the identification of trend reversals or continuations.
3. VWAP (Volume Weighted Average Price):
• VWAP is calculated over a default daily length (vwapLength) to show the average price a security has traded at throughout the day, based on both volume and price.
• Purpose: Provides insight into the fair value of the asset, indicating whether the market is in an accumulation or distribution phase.
4. RSI (Relative Strength Index) Filter:
• RSI is used to filter buy and sell signals, preventing trades in overbought or oversold conditions. It is calculated using a specified period (rsiPeriod).
• Purpose: Reduces false signals and improves trade accuracy by only allowing trades when RSI conditions align with volume and order flow signals.
5. Dynamic Support and Resistance Levels:
• The script dynamically plots support and resistance levels based on recent swing highs and lows (swingLookback).
• Purpose: Identifies potential reversal zones where price action may change direction, allowing for more precise entry and exit points.
How It Works:
• Buy Signal:
A buy signal is generated when:
• The price enters a high-volume zone.
• The price crosses above a 5-period moving average.
• The cumulative delta shows more buying pressure (cumulativeDelta > SMA of cumulativeDelta).
• The RSI is below 70 (not in overbought conditions).
• Sell Signal:
A sell signal is generated when:
• The price enters a high-volume zone.
• The price crosses below a 5-period moving average.
• The cumulative delta shows more selling pressure (cumulativeDelta < SMA of cumulativeDelta).
• The RSI is above 30 (not in oversold conditions).
• Dynamic Support and Resistance Lines:
Drawn based on recent swing highs and lows, these lines provide context for potential price reversals or breakouts.
• VWAP and Order Imbalance Lines:
Plotted to show the average traded price and highlight order flow shifts, helping to validate buy/sell signals.
How to Use:
1. Apply the Indicator:
Add the script to your chart and adjust the settings to match your trading style and preferred timeframe (optimized for M5/M15).
2. Interpret the Signals:
Use the buy and sell signals in conjunction with dynamic support/resistance, VWAP, and order imbalance lines to identify high-probability trade setups.
3. Monitor Alerts:
Set alerts for significant order flow events to receive notifications when there is a positive or negative order imbalance, indicating potential market shifts.
What Makes It Unique:
This script is unique because it combines multiple market analysis tools — relative volume zones, smart order flow, VWAP, RSI filtering, and dynamic support/resistance — to provide a well-rounded, multi-dimensional view of the market. This integration allows traders to make more informed decisions by validating signals across various indicators, enhancing overall trading accuracy and effectiveness.

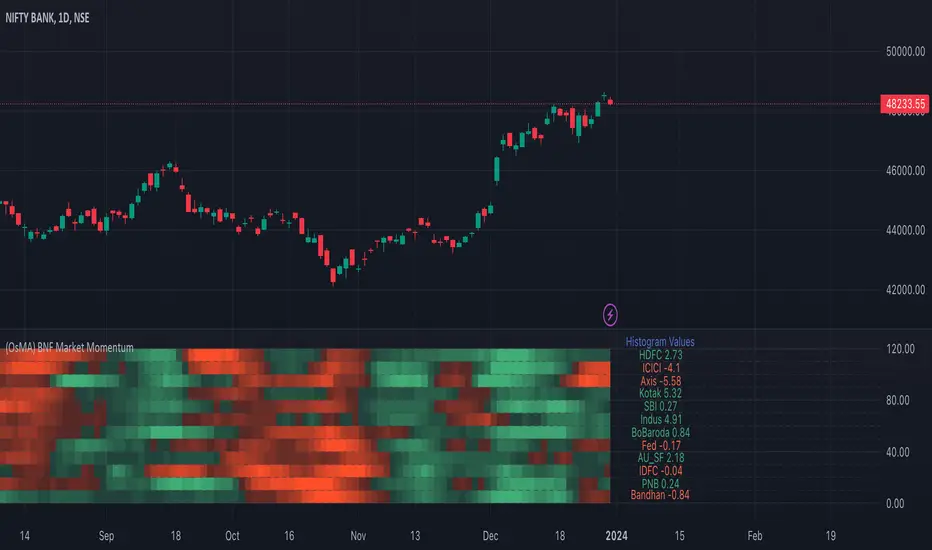
Bank Nifty Market Breadth (OsMA)This indicator is the market breadth for Bank Nifty (NSE:BANKNIFTY) index calculated on the histogram values of MACD indicator. Each row in this indicator is a representation of the histogram values of the individual stock that make up Bank Nifty. Components are listed in order of its weightage to Bank nifty index (Highest -> Lowest).
When you see Bank Nifty is on an uptrend on daily timeframe for the past 10 days, you can see what underlying stocks support that uptrend. The brighter the plot colour, the higher the momentum and vice versa. Looking at the individual rows that make up Bank Nifty, you can have an understanding if there is still enough momentum in the underlying stocks to go higher or are there many red plots showing up indicating a possible pullback or trend reversal.
The plot colours are shown as a percentage of the current histogram value taken from MACD from the highest histogram value of the previous 200 bars shown on the current timeframe. Look back value of 200 bars was chosen as it provided a better representation of the current value from its peak over the recent past(previous 200 bars), on all timeframes. Histogram value do grow/fall along with the underlying stock price, so choosing the chart's all-time high/low value as peak was not ideal. Labels on the right show the current histogram value.
Base Code taken from @fengyu05's S&P 500 Market Breadth indicator.
Bank nifty puller and Dragger Hello Guys
using the below script you can check the nifty bank puller and draggers at live
how to use it?
it's straightforward
in the table, we will see the points contribution by each bank to Bank nifty
graph shows the overall strength of the buyers and sellers
using graphs also you can trade
but If you want to use a graph please note these important points
1:when the evergreen line cut the red line from below to top (cross-over) it says that buyers are strong but sometimes cross-over may fail and fall again
2: same things happen with the red line also
3: sometimes the graph shows that's a big difference between the red line and the green line that the market opened gap up gap down ( its difficult to define ) will update soon
4:when the market consolidates red and green lines will be very near to each other
5: when the green line is upper side the buyers are strong when the red line is upside sellers are strong (but sometimes it may mislead please be careful )
using the table you can check the overall view of all important banks
according to the time frame, data will be shown
this image shows the break out at 12.45 pm
2nd image shows the consolidation face of the market
this image shows that directly after opening the market sellers became stronger
this is how you can use the indicator
you can use graph or you can use table to get the over all view of the Bank nifty

AI-Bank-Nifty Tech AnalysisThis code is a TradingView indicator that analyzes the Bank Nifty index of the Indian stock market. It uses various inputs to customize the indicator's appearance and analysis, such as enabling analysis based on the chart's timeframe, detecting bullish and bearish engulfing candles, and setting the table position and style.
The code imports an external script called BankNifty_CSM, which likely contains functions that calculate technical indicators such as the RSI, MACD, VWAP, and more. The code then defines several table cell colors and other styling parameters.
Next, the code defines a table to display the technical analysis of eight bank stocks in the Bank Nifty index. It then defines a function called get_BankComponent_Details that takes a stock symbol as input, requests the stock's OHLCV data, and calculates several technical indicators using the imported CSM_BankNifty functions.
The code also defines two functions called get_EngulfingBullish_Detection and get_EngulfingBearish_Detection to detect bullish and bearish engulfing candles.
Finally, the code calculates the technical analysis for each bank stock using the get_BankComponent_Details function and displays the results in the table. If the engulfing input is enabled, the code also checks for bullish and bearish engulfing candles and displays buy/sell signals accordingly.
The FRAMA stands for "Fractal Adaptive Moving Average," which is a type of moving average that adjusts its smoothing factor based on the fractal dimension of the price data. The fractal dimension reflects self-similarity at different scales. The FRAMA uses this property to adapt to the scale of price movements, capturing short-term and long-term trends while minimizing lag. The FRAMA was developed by John F. Ehlers and is commonly used by traders and analysts in technical analysis to identify trends and generate buy and sell signals. I tried to create this indicator in Pine.
In this context, "RS" stands for "Relative Strength," which is a technical indicator that compares the performance of a particular stock or market sector against a benchmark index.
The "Alligator" is a technical analysis tool that consists of three smoothed moving averages. Introduced by Bill Williams in his book "Trading Chaos," the three lines are called the Jaw, Teeth, and Lips of the Alligator. The Alligator indicator helps traders identify the trend direction and its strength, as well as potential entry and exit points. When the three lines are intertwined or close to each other, it indicates a range-bound market, while a divergence between them indicates a trending market. The position of the price in relation to the Alligator lines can also provide signals, such as a buy signal when the price crosses above the Alligator lines and a sell signal when the price crosses below them.
In addition to these, we have several other commonly used technical indicators, such as MACD, RSI, MFI (Money Flow Index), VWAP, EMA, and Supertrend. I used all the built-in functions for these indicators from TradingView. Thanks to the developer of this TradingView Indicator.
I also created a BankNifty Components Table and checked it on the dashboard.

BankNifty Dash
This indicator to be used only in BankNifty , shows Values of BankNifty Index & its top constituents.
Dashboard Interpretation :
LTP - Last Traded Price.
D High - Day High.
D Low - Day Low.
I Points - Shows the contribution of top BankNifty constituents according to its weightage.
PH-PL - "PH - PL" means LTP is trading between Previous Days High( PH ) & Previous Days Low( PL ) which indicates Rangebound-ness.
"+ PH" means LTP is trading above Previous Days High( PH ) which indicates Bullish-ness.
"- PL" means LTP is trading below Previous Days Low( PL ) which indicates Bearish-ness.
ATR - Displays the Daily ATR (Average True Range) (14 period).
DTR - Current Day Range.
DTR% - Current Day Range percentage.
( DTR & DTR%, changes colour based on percent value. < 61.8 is green and > 61.8 is red.)
For example if the Daily ATR is 100 and the current range of the day is 200 this would be 200% the original move.
EMA:-
Default value of 5 is used in Fast EMA.
Default value of 21 is used in Slow EMA.
Default value of 200 is used in EMA (Used for trend direction).
User can change values from input section.
If the colour filled between Fast EMA and Slow EMA is green, the market is in a uptrend
If the colour filled between Fast EMA and Slow EMA is red, the market is in a downtrend.
ADR :-
Plots ADR (Average Day Range) zones are used as support and resistance, ADR zones are calculated using a 5 or 10 day period unless you change the settings.
PDH/PDL :-
Plots Previous Day High(PDH) and Previous Day low(PDL).

BankNifty Modified McClellan OscillatorThe McClellan Oscillator developed by Marian McClellan is a useful breadth indicator because it describes the acceleration that takes place in the breadth numbers.
How to read McClellan Oscillator
A positive or negative value gives a simplistic bullish or bearish statement about the short-term trend of the market
Very low readings show oversold conditions
Very high readings show overbought conditions
Divergences are also important to look for as a sign that the strength of a trend is waning
Here same oscillator is rebuilded for BANKNIFTY using the difference between Capital weighted Up Volume and Down Volume instead of Advance - Decline.
