ATR-warningLarge candles are not always a suitable place to trade, or it could be the perfect place to trade.
This script plots a small rectangle at the top of the chart when a candle is larger than the specified ATR.
Rata-Rata Rentang Sebenarnya / Average True Range (ATR)

Decomposed Average True RangeThis simple script decomposes the value of the Average True Range into a bullish component and a bearish component .
The script supports two plotting methods; Mirrored and Two Lines . If Mirrored is chosen, the indicator plots the bullish component as a positive number, and the bearish component as a negative number. If Two Lines is chosen, the indicator plots two lines, both of positive values. It is the same data, just visualized differently.
Side note: This is very similar to how the strength (average gain) part in the Relative Strength Index calculation works. However, the RSI uses the realized range (close - previous close) rather than true range. If we were to use the bullish component of the ATR as the average bullish gain part in the RSI calculation, and the bearish component of the ATR as the average bearish gain part in the RSI calculation, we would get very similar (but not equal) results to the standard RSI. This shows how the ATR and the RSI are related to each other.

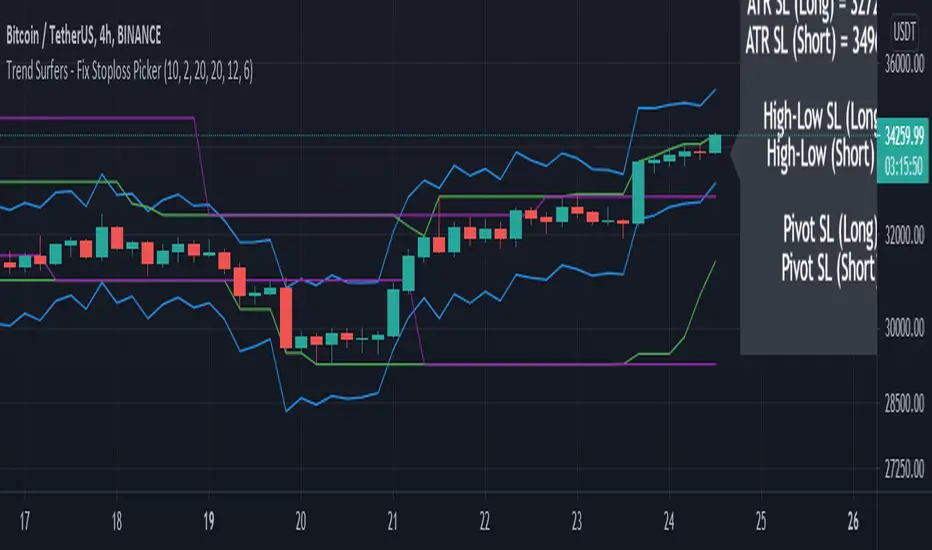
Trend Surfers - Fix Stoploss PickerThis study include 3 types of stop-loss (ATR, High/Low and Pivot point)
This script aimed to help new traders to respect risk management.
Simply select which stop-loss you would like to use in the settings and the suggested stop-loss will be displayed on the chart for Long and Short positions.
Please let me know in the comment if you would like me to add more indicators for the stop-loss in this script.
Hope you like it!
MA, MATR, ChEx | All in One - 4CR CUPIn trade position setup, we always need to determine the market structure and manage the position sizing in a short period of decision time. Indicators such as moving average, initial stop loss and trailing stop loss are always helpful.
This indicator put all these handy tools into a single toolkit, which includes the following price action and risk management indicators:
MA - Moving Average
MATR - Moving Average less Average True Range
ChEx - Chandelier Exit
This script further enhances the setting so that you can easily customize the indicators.
For both the Moving Averages and the Moving Average less Average True Range , you can pick a type of moving average which suits your analysis style from a list of commonly used moving average formulations: namely, EMA , HMA , RMA, SMA and WMA , where EMA is selected as default.
The Moving Average less Average True Range , MATR, is usually applied as a reference to set the initial stop loss whenever opening a new position.
The abbreviation, MATR, is picked, so that this can serve as a handy reminder of a very good trading framework as elaborates as below:
M – Market Structure
A – Area of Value
T – Trigger
R – Risk Management (aka. Exit Strategy)

Mandelbrot's RangeThis uses a Rescaled Range from Benoit Mandelbrot's Misbehavior of Markets to devise a Risk Range on stocks. A trading position can be managed by selling portions at the top of the risk range and selling at the bottom of the risk range.
The Length parameter defines how wide the range is and how frequently the price will reach the range bands.
The Vol Length Parameter defines how far back to weight volatility, and how responsive the bands will be in response to volatility

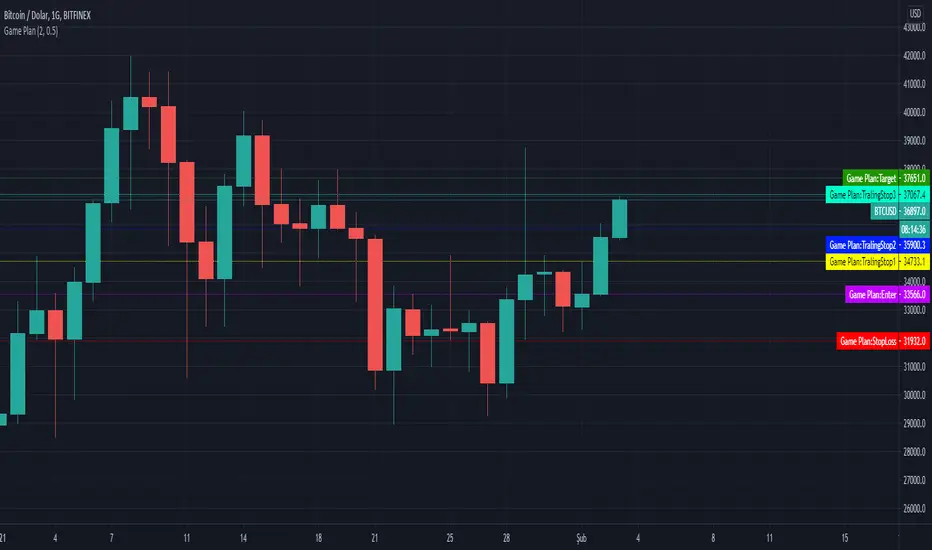
Game PlanAllows to automatically calculate Ali Persembe's, who wrote Teknik Analiz mi Dedin? Hadi canım sende, Game Plan Strategy
What is the Game Plan?
ALi Persembe claims, If you create a game plan for yourself and follow this plan completely, you will increase your profit. He tells that there is nothing to surprise you when your stop loss and target is determined in your game plan. You only need to follow this plan.
How does the indicator work?
It helps you determine your target price and stop point according to the risk ratio you will take on the basis of Atr, regardless of technical analysis.
The minumum risk ratio is calculated as 0.5 Atr according to the Atr 14 period. It automatically sets 2.5 times the risk ratio taken as your target price.
With this game plan, the more goals you reach by trading, the more profitable you will be. By reaching your target at risk ratio, you can determine the stops that follow the
Allows you to move your stoploss level up.
You can change your risk rate in the indicator settings. Minumum risk rate can be 0.5 maximum can be 5.
You can also choose the time you want to calculate your game plan from the indicator settings. Calculation can be made up to 100 bars before.
This indicator helps you to set a target on the basis of ATR, independent of technical analysis.
Position Size Calculator - Fixed Dollar amount, point value ATRHello Traders,
A very simple code aiming to help you size your position, according to the amount you're accepting to lose AND the current volatility ATR.
Why is it important to use ATR size ? Markets move, and having fixed stoploss values will lead to getting stopped out in case of volatility increase.
You also need to size down your trades in case of more volatily, as more points can be taken or lost.
Hope it helps!
Kudos to Racer9 who inspired me :

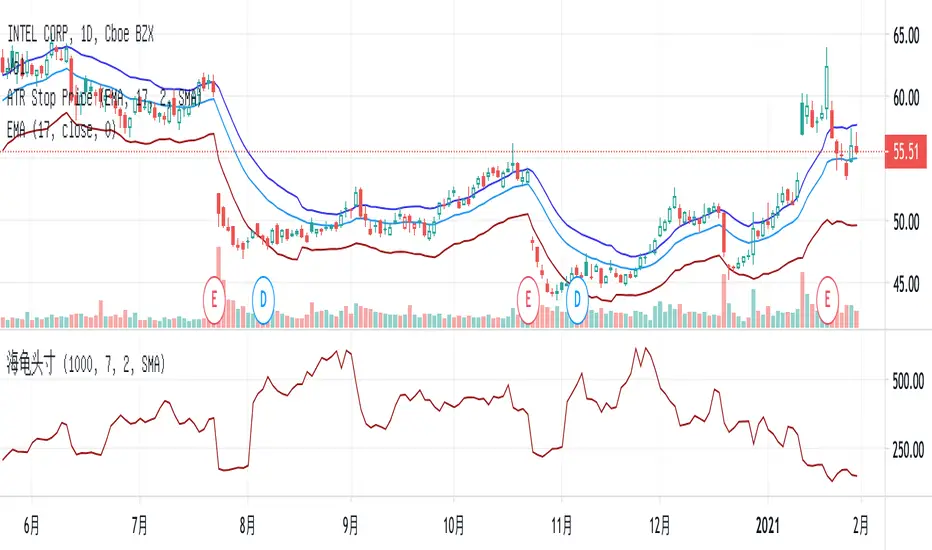
ATR Stop PriceSet stop price and add-position price according to the cost and current ATR.
You may set an alert with the condition when the stock price crossing down the Stop Price.
Example:
stock price: $150
volatility multiple: 2
current ATR: $3
stop price = $150 - $3 * 2 = $144
add-position price = $150 + $3 * 2 / 2 = $153
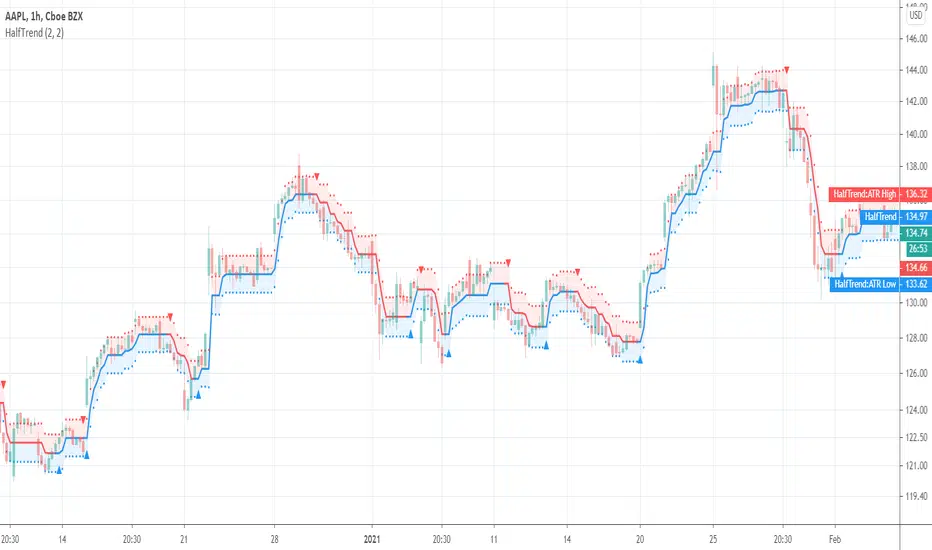
HalfTrendA popular trend indicator based on ATR. Similar to the SuperTrend but uses a different trend's identification logic.
I am publishing a disclosed code without license. Remember that in the future you may see a lot of paid IO scripts called BuySellScalper, Trend Trader Karan, Trend Trader and etc (by other authors) which will be based on this script. I found the same script on Ebay for $10 with a free shipping. Beware, always check and follow one Russian wisdom: "Do not pay for something you can get for free".
ATR-DAY TRADER AHINSTEAD OF HAVING AN EXTRA TAB AT BOTTOM OF THE CHART THIS ATR DOES THE SAME WORK WITHOUT GIVING ANY ADDITIONAL TABS. IT JUST GIVES A VALUE AT THE LEFT HAND SIDE TOP, WHERE WE SEE ALL OUR INDICATOR SETTINGS DISPLAYED. AS ATR IS USED MAJORLY FOR SETTING UP PROPER STOPLOSS THE ONLY THING I PERSONALY NEED IN HANDY IS THE VALUE AT THE SIDE.
HOPE THAT THIS HELPS FOR MANY PEOPLE AROUND THERE WHO DO NOT WISH TO MAKE THE SCREEN COMPACT AND LOOK LOST WHILE TRADING BY ADDING TO MANY INDICATORS.
THANKS & REGARDS -
DAY TRADER AH
@HUZAIFA_786

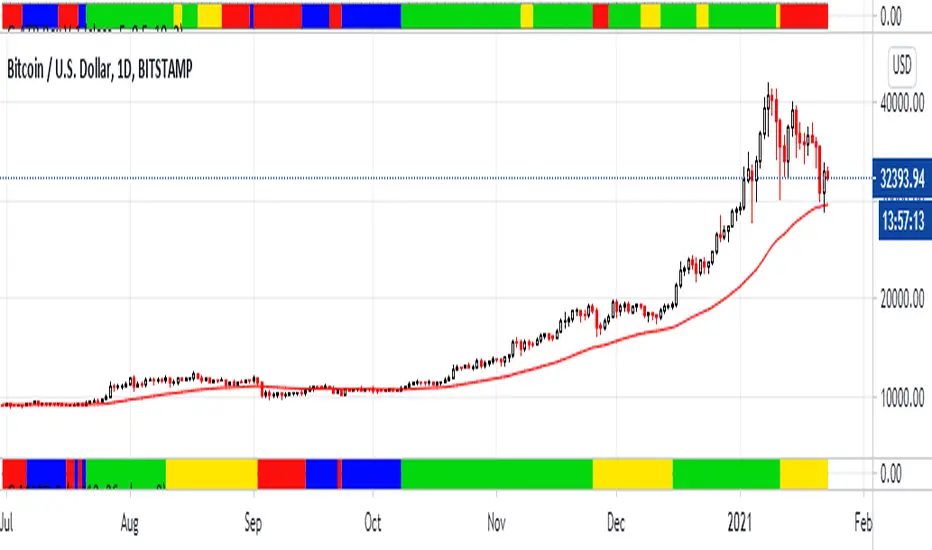
G-ATR Box V.1Hello this is my new adapt indicator "G-ATR Box V.1"
It's just nearly normal ATR but I create in box color. My problem when I use ATR trailing stop my screen is not clean and when I use finonacci or trend line is hard to see.
How to use
Blue = Pre-buy : Waiting for another buy signal
Green = Buy : Holding the stock
Yellow = Weak uptrend : Waiting for Sell signal
Red = Sell
In this screen I compare G-ATR Box(above) with G-MACD color(below)
When the stock strong uptend all of G-ATR and G-MACD is very work and When weak uptrend G-ATR is action frist but beware Bear trap too
goodluck
Auto Position Sizing Risk RewardThe Auto Position Sizing Risk Reward indicator shows different Risk levels 1, 1.5, 2 and 3 based on your risk amount and uses an auto Stoploss level based on the ATR.
You can set the values for the "Note or Title", "Risk Amount", "Entry", "Target Price", "Stop Loss Distance", "Default Risk/Reward" and ATR settings.
The "auto" part comes into play when you haven't yet set an Entry value, which will make everything update according to the latest Closing price of the asset.
Once you set the Entry price, the Risk/Reward levels will stop updating their positions and stay in place. This allows you to dynamically see your potential Risk/Reward as the market progresses, as well as locking in your Risk/Reward levels once you are ready to enter a position.
Your Position Size as well as actual Stoploss level and Cost is displayed along with the other values in the textbox that floats next to the R/R levels.
This indicator was inspired by and relies heavily on the work done by zzzcrypto123 and NXT2017 in their indicators, but I felt that this version is unique enough to hopefully be of use to the general community.
I hope this helps you to trade better! Please feel free to improve it and provide suggestions.

Running Bound based on ATR multiplierThis script basically uses default ATR and then
Multiplies with ATR multiplier (3 for crypto and 2 for forex) - you can change the values from the settings if you like
Adds/subtracts from the current price
And tries to find a bound on both side of price
Range support and resistanceWelcome all
==========
This script specially is for Kunal Saraogi Senani Traders and beginners.
.
With this script you can find support and resistance for input range on any time-frame chart.
You need not draw line by own. You just input your desired range and this script will do your work automatically.
You can adjust range according to your choice.
Also have an option to select range source which help you to find support and resistance on the basis of close price or high/low of input range. Default range source is close price.
.
Latest support and resistance value labels also display on the chart.
.
To use this script, add to favorite and apply on chart.
.
Feel free to comment your suggestions.
.
Thanks all
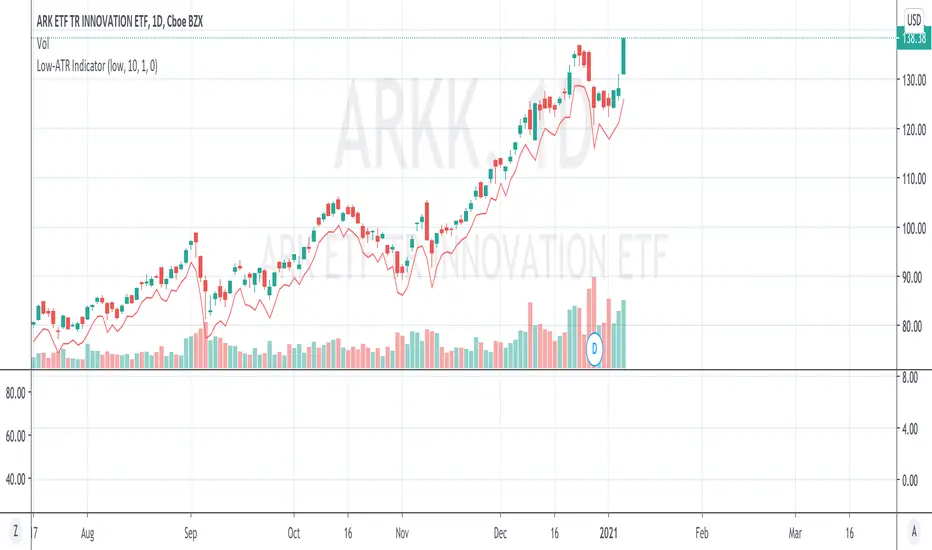
Low-ATR IndicatorWe often want to use a stop loss at a certain low - N*ATR,
But it is too troublesome to manually calculate a certain day low - ATR.
This indicator simply calculates it for you, by marking the value of day low - ATR.
By default the hardcoded ATR value is 0, which means "Uses the ATR at that day with configured look back period".
If you want to use a specific ATR value, e.g.
1) You want to set the stop loss using today's ATR but another day's day low (Very often)
2) You want to set the stop loss in another timeframe - N*ATR
You can type in the value of ATR into the "hardcoded ATR" field.
(Actually this should be the most used way)
Average Ranges - MMFxThis is a script that has Average Daily Ranges, as well as Weekly, Monthly, and Yearly Ranges
Users can edit:
ADR display limit - Set the number of historical ADR to display.
AWR display limit - Set the number of historical AWR to display.
AMR display limit - Set the number of historical AMR to display.
AYR display limit - Set the number of historical AYR to display.
ADR Length parameter - Set the length parameter of ADR.
WDR Length parameter - Set the length parameter of AWR.
MDR Length parameter - Set the length parameter of AMR.
YDR Length parameter - Set the length parameter of AYR.
Ranges are to be used with price action, and Market Maker Method knowledge to catch reversals and stop hunt points
Kendall Garro 2021
MasterMind FX

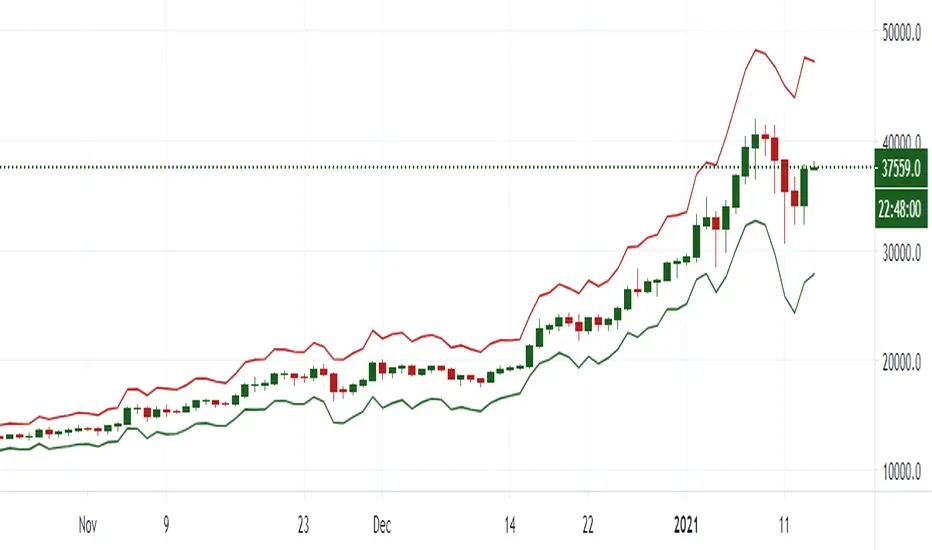
Adoptive Supertrend - Multi PivotsThis is extension to Adoptive Supertrend Pivots indicator published here:
In this version, we make use of both high time frame and lower time frame pivots for efficient trailing of stops in case of bull run such as BTC. If we take example of BTC, no new pivot lows formed from 25th December. This means, our trailing stop is also stuck at ridiculously low level of 20k whereas BTC has nearly hit high of 35k.
Our approach to solve this is by looking at lower time-frame pivots for deriving our trailing stop-loss if stop-loss is too wide from the close price. If the stop-loss isn't wide and new daily pivot lows are forming every now and then, then this indicator will work same as the earlier version of Pivots based Adoptive Supertrend.
There seems to be issue in calculating lower time-frame Pivots and moving stop based on that while being in higher time-frame. Hence, we need to shift to lower time frame chart while making all the calculations such as ATR are done on higher time-frame.
Hence, if you are looking to trade on daily chart, it is advisable to use this indicator on 1H, 2H or 4H chart while keeping parameter HTFResultion set to 1D
Parameters are explained as below:
HTF Resolution : Main resolution on which we need to apply supertrend calculation based on pivots. ATR and Pivot HTF are calculated on this resolution.
Stop Distance Threshold : This is the minimum stop distance from close price in terms of percentage after which we can look for lower time-frame pivots for calculation of trailing stop. If stop loss keeps less than this percent, then lower time frame pivots are not used for calculating trailing stop loss.
ATR Parameters : We use only higher time-frame ATR. Hence, ATR is calculated based on just one ATR Period for both cases. But, we can chose to have different ATR Multiplier for HTF and LTF. Using slightly higher ATR multiplier for lower time-frame than that of higher time-frame is advisable.
Pivot Lengths : You can use different pivot lengths for higher and lower time-frames. We have removed Left and right pivot lengths for keeping it simple. Both will have same value based on selected pivot length for respective time-frames. Using higher Pivot length for lower time-frame is advisable to avoid frequent trailing.

Jackrabbit.SR-ATR-DCAThis is a standalone version of the Support and Resistance/Average True Range paradigm for the Jackrabbit suite and modulus framework. This module does not have a signal line and does not support integration with other modules.
Support and Resistance and ATR are preset and tuned to very specific settings for maximum profitability.
The blue line is the current average price of the asset.
The red line is the deviation boundary. Price action must be below this line for buys to be signaled.
The green line is the take profit. Price action must be above this line for a sell signal to be generated.
Here is a list of the settings:
Buy method: DCA or Strategy. DCA allows the module to decide buys based upon the methodology (step, price). Strategy added to the average on the basis of a buy signal from the strategy, but only when it is below the deviation and is the most organic of dollar cost averaging.
Sell Method. Take profit or Steategy. Take Profit sells the asset as soon as the price action crosses above the take profit line. Strategy sells on the basis of a sell signal, but only if it is above the take profit. Selling never occurs at a loss, with the only exception being the exit point.
Methodolgy: Step or Price. Stepping allows a fixed and uniform averaging ant percise intervals of deviation. Price is a very aggressive approach that will drive the average down on the basis of the difference between the average and the current price action. The price methodology is VERY high risk.
Take Profit, which describes the average profit percent of the combined positions.
Deviation, which describes the percent boundary for which price action must drop before additional assets are purchased.
Sideways Breaker: This algorithm breaks the sideways rut by forcing a purchase after X days, minimum 1 day.
Exit Position: Internal stop loss expressed in the number of buys.
It is important that when you establish your sell signal, ALL positions must be sold to ensure the average profit. If required, use a CLOSE ALL message provided by your platform. Also, any platform specific DCA or Safety Orders will cause losses as this script can not track their value. It is recommended that these features not be used.
This script is by invitation only. To learn more about accessing this script, please see my signature or send me a PM. Thank you.

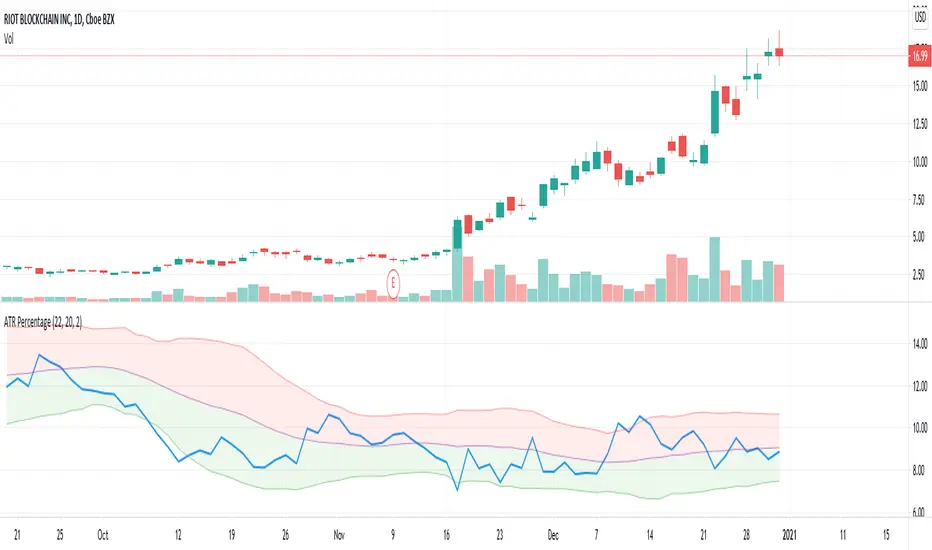
ATR PercentageThis indicator plots ATR as percentage of close price. Also applying bollinger bands on it to visualize it is relatively high or low.
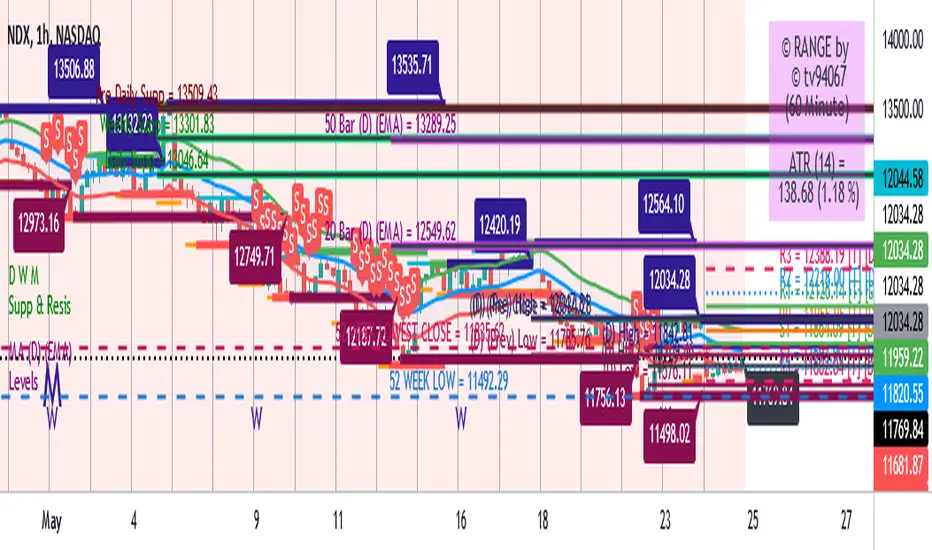
[JRL] ATR Pivot PointsThis indicator plots pivot points with support and resistance lines based on average true range (ATR). ATR is one of the best volatility and trading range predictors, so it can be very useful for finding confluence in any strategy.

Normalized Volatility IndicatorFrom an article by Rajesh Kayakkal:
"Early bear phase signals can help you get out of the market before it turns down. This indicator tells you how.
There are many ways to identify the trend of a financial market, the most common being the 200-day exponential moving average (Ema). When price is trending down below the 200-day Ema, the market is believed to be in a bear phase. If the market is trending up above the 200-day Ema, it is considered to be in a bull phase.
Since every indicator fails at times, I wanted to find other indicators to confirm a trend. In my quest for another indicator to determine the trend for the financial markets, I found the Cboe Volatility Index (Vix) to be a good indicator of the market direction. The Vix is calculated from the weighted average of the implied volatilities of various options on the Standard & Poor’s 500 index futures.
J. Welles Wilder’s average true range can also give an indication of the financial market trends; that is, when the market is in a bull phase, the average true range narrows, and when it is in a bear phase, the average true range expands. The normalized volatility indicator (Nvi) is based on this behavior.
Normalized volatility indicator (Nvi)
Average true range (Atr) varies depending on time. But how do we determine the phase of the financial market with Atr? Perhaps some type of ratio could give us a clue. A ratio presents a relationship of a quantity with respect to another. I did some research based on a ratio of the 64-day average true range and the end-of-day value of equity indexes such as the Standard & Poor’s 500 (Spx). I selected the 64-day period since it is close to the average number of trading days in a quarter. The ratio of the 64-day average true range and closing price does discount seasonal variations in the average true range and gives a single number that can be used to compare volatility of an instrument across many decades. I call this ratio the normalized volatility indicator.
I found an interesting correlation between Nvi and cycles of major equity market indexes. The formula for the Nvi is:
Nvi = 64 - Day average true range/End-of-day price * 100
The NVI gave advanced signals before the cyclical bear phase of SPX commenced in October 2000 and was almost on the spot with the bull phase that began in 2003 and the current secular bear market cycle, which started in November 2007."
Includes options to show inverse NVI and change the ATR length and smoothing.

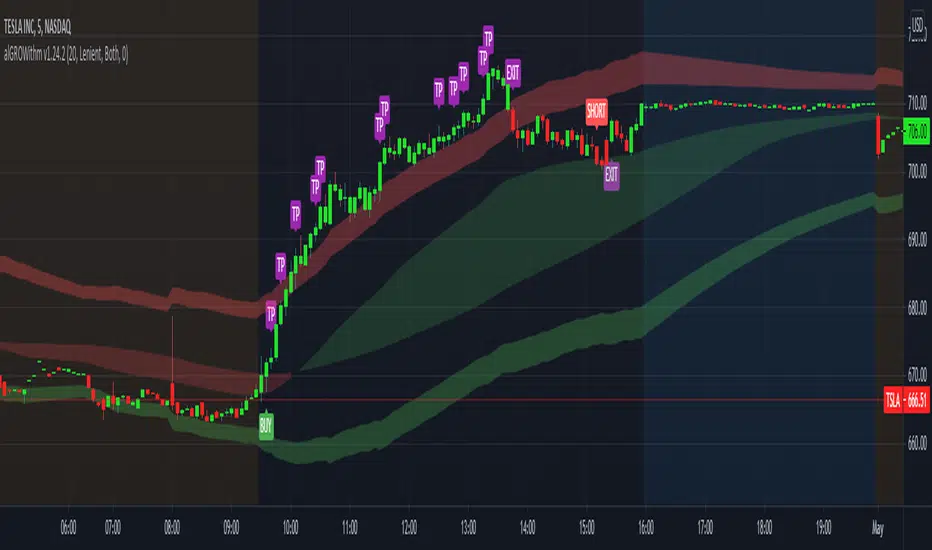
alGROWithm PremiumIntroducing the alGROWithm indicator!
Years of trading experience and endless hours of screen time has undeniably proven to me that the most fundamental rule of any market is: price moves from supply to supply and demand to demand. Specifically, this means that a breakout of a supply zone , the probability of it reaching the next supply zone before starting consolidate is very high. Similarly, a breakdown from previous demand zone will likely continue to the next demand zone . The identification method of these supply and demand channels is one of the features that sets this indicator apart from other available tools.
What separates alGROWithm from other available tools?
- Proprietary method for identifying supply & demand channels combined with a directional bias computation based on recent historical prices
- Only signaling precise entries based on supply & demand that maximize R/R
- Tracking open positions and displaying a trading plan directly on the chart immediately after signaling entry points
- Indicating precise exit levels to help you avoid exiting too early or trading by emotion
What are the features included in alGROWithm?
Trading Plan Lines : These are the Buy/Short/Take Profit/Exit lines plotted directly on the chart
Show Long Signals : These are the green "BUY" labels that appear on the chart when alGROWithm identifies a critical breakout to the next supply level
Show Short Signals : These are the red "SHORT" labels that appear on the chart when alGROWithm identifies a critical breakdown to the next demand level
Show Take Profit Signals : These are the purple "TP" labels that appear on the chart when alGROWithm identifies that the subsequent supply/ demand level has been hit
Show Exit/Stop Loss Signals : These are the purple "EXIT" labels that appear on the chart when alGROWithm identifies that the trade has run its course and it's time to exit
Show Dashboard : This is a dashboard that is displayed to the right of the latest candle, and contains the following information:
- Current Position : "Long", "Short", or "None"
- Next Profit Target : Only displays if there is an active Position
- Current Bias : alGROWithm computes a directional bias based on recent historical prices. Text will say "Long" or "Short"
- Long/Short Bias Until : alGROWithm's bias will change if this price is hit. Note that these are not BUY or SELL levels - this simply indicates whether things are looking up or down
- Enter Short/Long At : Only displays if Current Position = "None"
Note that you can enable/disable any of these chart overlays at anytime through the indicator settings.
The alGROWithm indicator works on any timeframe, any market, and standard OR Heikin Ashi candlesticks .
I have been working very hard on this indicator and I personally use it on a daily basis with options trading. I am so excited to share the wealth with you!
You can use the link below to visit our website and gain access to the script.
Indicator - ATR Profit Loss - DGHi Traders,
This is an on chart indicator that can be used for setting take profit and stop losses very easily using the Average True Range Indicator (ATR). Using a volatility adjusted TP and SL will allow you to set your targets and losses based on market conditions. In the settings, you are able to adjust how much of a multiplier you require depending on your risk tolerance and strategy. For those that follow the NNFX method, the defult settings are preset to 1xATR TP and 1.5xATR SL.
How to use:
- For longs, 'isLong' box must be ticked, for shorts, this box is unticked
- For longs, green line is TP, red line is SL
- For shorts, red line is TP, green line is SL
Regards,
Dillon Grech
