Roc & Atr
Roc & Atr Orders
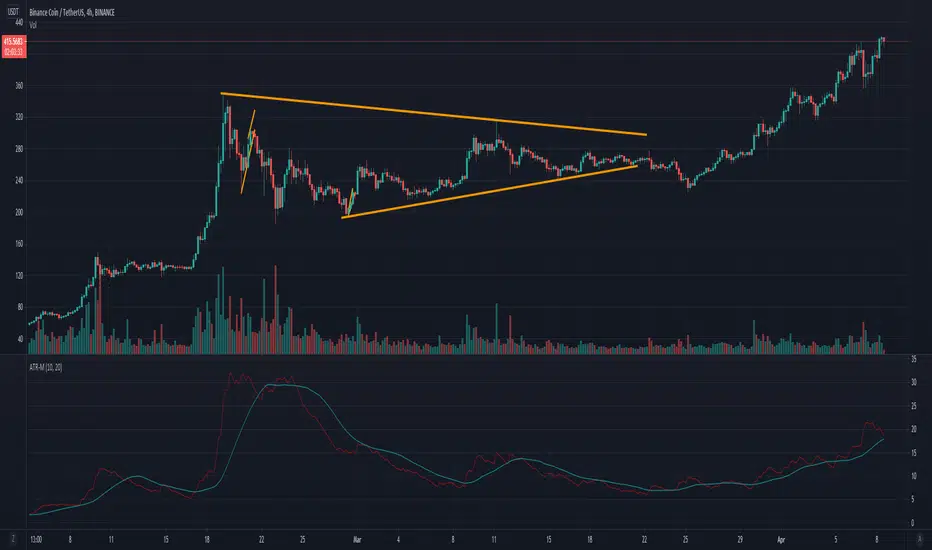
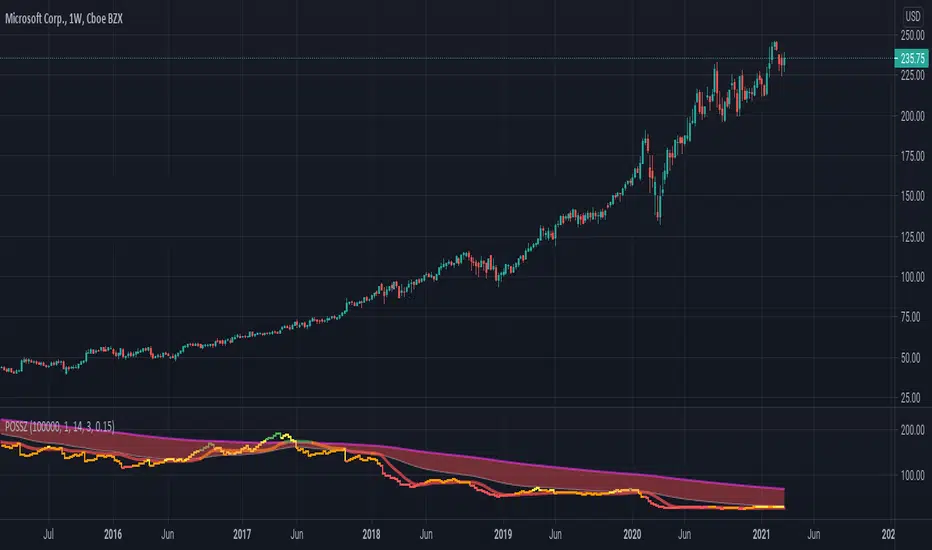
My indicator, where I compare the 20 bar change percentage with the 14 bar atr band, I hope it will be useful to everyone. the green zones can be interpreted as BUY and the red zone as SELL zone. In graphs with high motion and low atr, the channel narrowing can be interpreted as BUY and the channel opening as SELL.
No indicator shows you the right way ... The best way is your own thoughts
Rata-Rata Rentang Sebenarnya / Average True Range (ATR)

ATR Daily Levels Band NakitxuAverage True Range
What Is the Average True Range (ATR)?
The average true range (ATR) is a technical analysis indicator, that measures market volatility by decomposing the entire range of an asset price for that period.
The true range indicator is taken as the greatest of the following: current high less the current low; the absolute value of the current high less the previous close; and the absolute value of the current low less the previous close.
The ATR is then a moving average, generally using 14 days, of the true ranges.
This script is an especial request of a TradingView user.
Shows 5 levels based on ATR daily, plotted in wherever timeframe you are using:
level 1: prv day ATR + prv day close
level 2: prv day ATR + prv day high
level 3: level 2 - prv day ATR
level 4: prv day close - prv day ATR
level 5: prv day low - prv day
Only show the levels if you are in a timeframe daily or lower than daily.


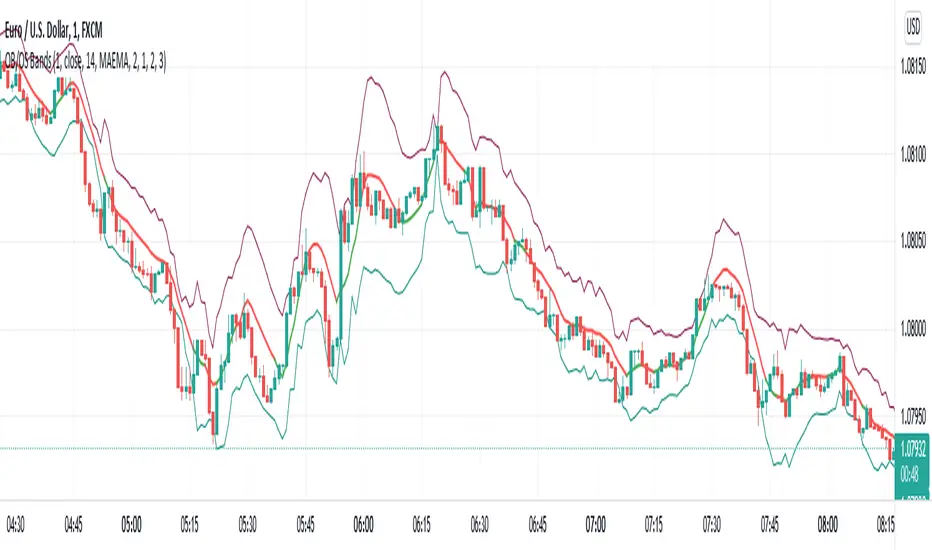
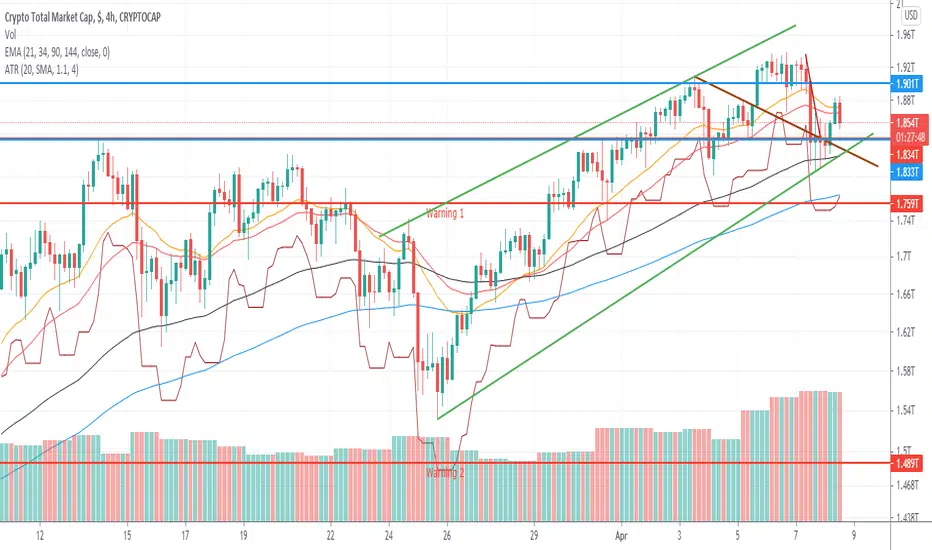
Overbought/Oversold BandsThe basis of this script is my "Hybrid Overbought/Oversold Detector" which uses many different oscillators to confirm overbought/oversold conditions. The main idea is to generate higher and lower bands around the desired moving average using an average of the volatility (ATR) and the standard deviation (StDev), of course by interfering detected overbought/oversold condition.
Simply put, the more the asset become overvalued/undervalued, the tighter the channel would be and every breakout of the bands announces a return back into the channel in near future.
By default, the multiplier of the standard deviation in the indicator settings is set to 2 which means only less than 5% of price actions would appear outside the bands. Also the default multiplier of the ATR is set to 3 which leads to some similar result, but to achieve more strict results setting StDev multiplier to 3 and ATR multiplier to 4 would be useful.
The type of the central moving average could be picked up from 6 different types which are:
- SMA (Simple Moving Average)
- EMA (Exponential Moving Average)
- HMA (Hull Moving Average)
- LSMA (Least Squares Moving Average)
- TMA (Triangular Moving Average)
- MAEMA (My Personalized Momentum Adjusted EMA)
The latter one leads to a useful combination of the channel with the momentum.
Also the script has multi-timeframe features and the user could apply calculations from other time frames to the current chart.
Hope the idea would be helpful!
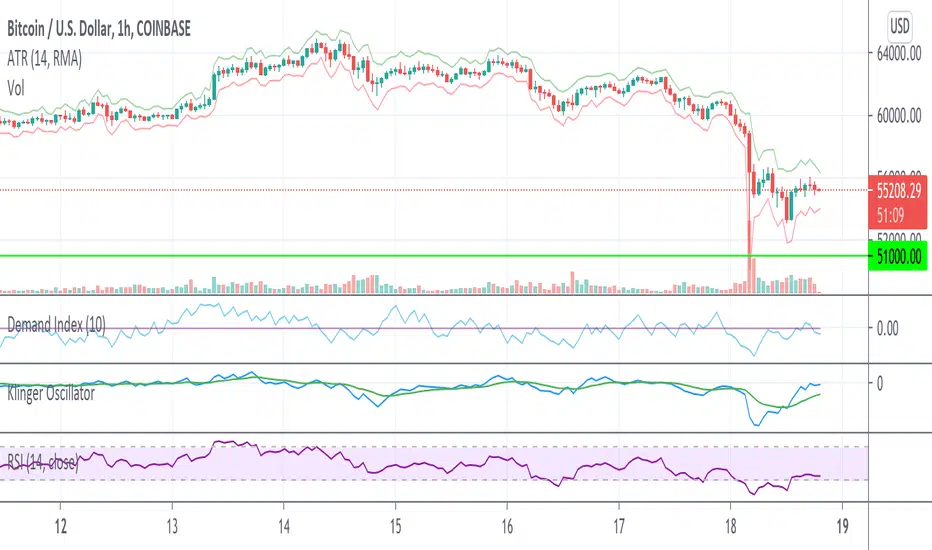
Advanced Average True RangeThis indicator allows you to improve your stop loss placement. It displays two lines based on the ATR ( Average True Range ), an upper line based on the current price + ATR and a lower line based on the current price - ATR. The ATR is multiplied by 2 but you can change this in the indicator settings.

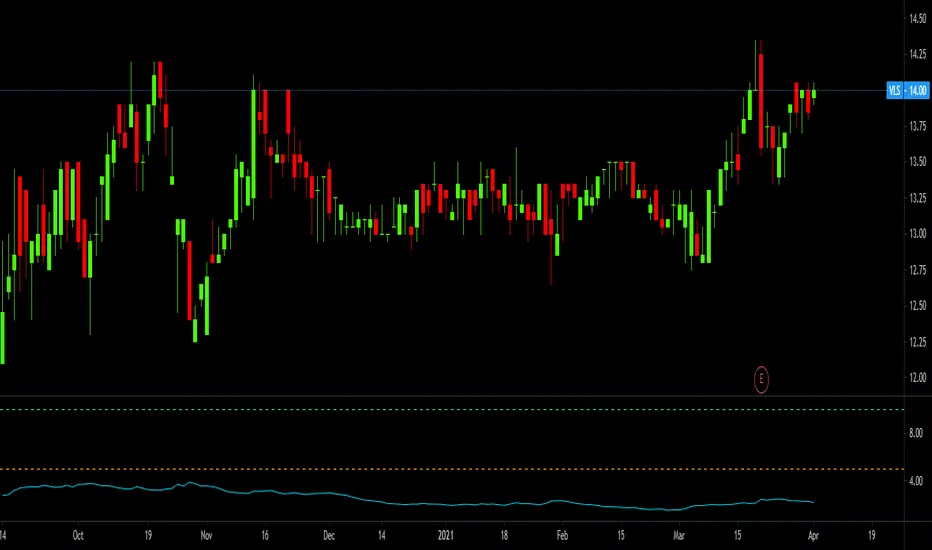
Dziwne MFI Overlay (with highlight)It is simply your traditional MFI , except that your 50 line became the actual price.
Why and how could it be useful? This indicator helps to spot more easily and efficiently divergences .
You could also use it for trend reversals as you usually do with your 50 line, but I would suggest to set a higher length for the MFI, like 155 or something like that.

ATR Stop BandView ATR Stop in a different timeframe, the default timeframe is 1D, the default ATR multiplier is 60%.
upperStop = current high + dayATR * 60%;
lowerStop = current low - dayATR * 60%;

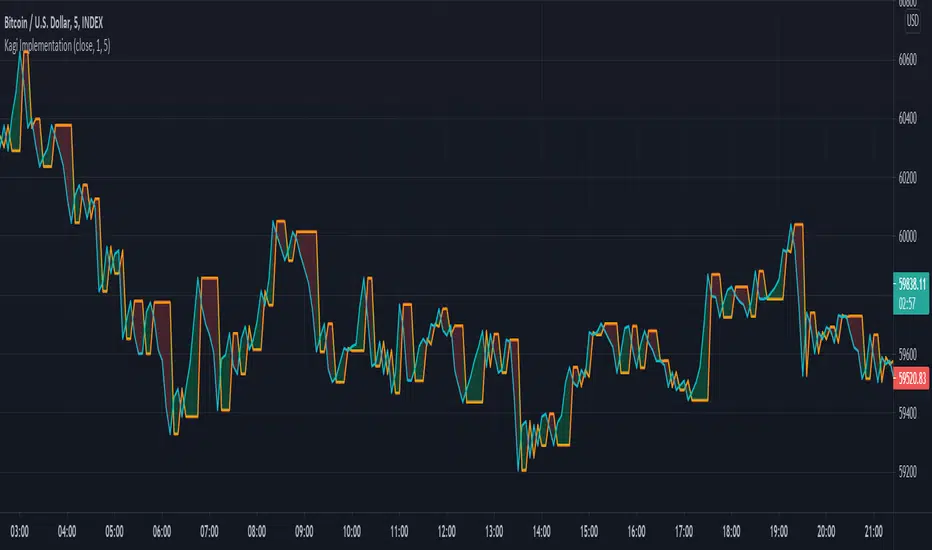
Kagi Implementation (+ATR)My Own Kagi Indicator Implementation!
I couldn't find anywhere on the internet a simple implementation of the Kagi indicator (apart from a seemingly complicated JavaScript implementation).
So I decided to implement it myself and test it against the built-in Kagi indicator calculated by the built-in security function - They ended up exactly the same! (You can see my orange plot completely covers the security's purple plot)
My calculations are based on this article from a site called "euroland", the article is called "Kagi Chart" (I can't post the link because of TradingView restrictions)
Bonus: The built-in kagi indicator uses only Fixed Amount Reversal Size. One that is interested in an ATR Reversal Size can modify the calculation a bit (see script's comments) to easily create and use it.
Some interesting info about the security function I discovered while doing this script:
After I implemented it I noticed that my calculations are the same except the fact that all my values are delayed by 1 bar (relative to the security's indicator). After some research I discovered that the security function uses future data in it's calculation and therefore it cannot be trusted for testing live-trading strategies, unless it is given the appropriate parameters (see script for example).
Have fun trading and don't lose money!
ATR-MSimple ATR with a moving average signal line. Play with the inputs, I suggest making the MA longer than the ATR length for a more reactive outcome. This is a great tool for trend trading!
There are two main uses for this indicator:
1. Filtering out losing trades
- Take trades when the ATR is above the signal line.
2. Identifying trends and slow downs to trends
- Ride trending markets.
- Be weary of the ATR crossing below the signal line, a reversal or pause in the trend is coming.
I'm sure something like this exists on TV but I haven't seen it yet. I'm new to making indicators and trading in general yet this tool looks to eliminate a lot of losing trades my entry indicator took during noisy/dead markets.
I hope this helps somebody out!
ATR For Stop Loss (Overlay)This script is an enhancement of ATR Indicator.
It is used to determine the stop loss position by using the ATR indicator, in conjunction with the low of the candle.
Formula = Stop Loss = Lowest(Lowest Length) - (ATR Multiplier * ATR (Smoothing, Length))
However, the user needs to manually identify the swing low for a better stop loss placement.
Parameter Information :
- Length : Period to calculate the average true range.
- Smoothing : The method used for averaging.
- ATR Multiplier : Multiplier factor to determine the Stop Loss from the lowest reference point. (1 ATR Multiplier means the stop loss would be = Low - ATR)
- Lowest Length : A total number of candle to determine the lowest reference point. (1 means only using the latest candle's low as a lowest reference point)
Have fun and good luck!
ATR PercentAverage True Range in Percent to price
- 2 customizable horizontal line: to be used as custom levels.
ATR SL/TPThis indicator uses the ATR to give areas where the user might want to take profit or set a stop loss.

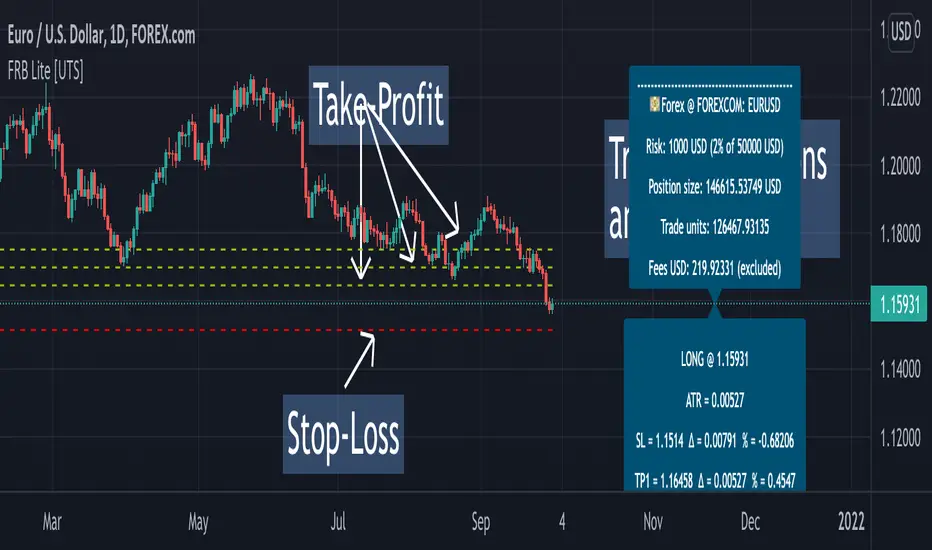
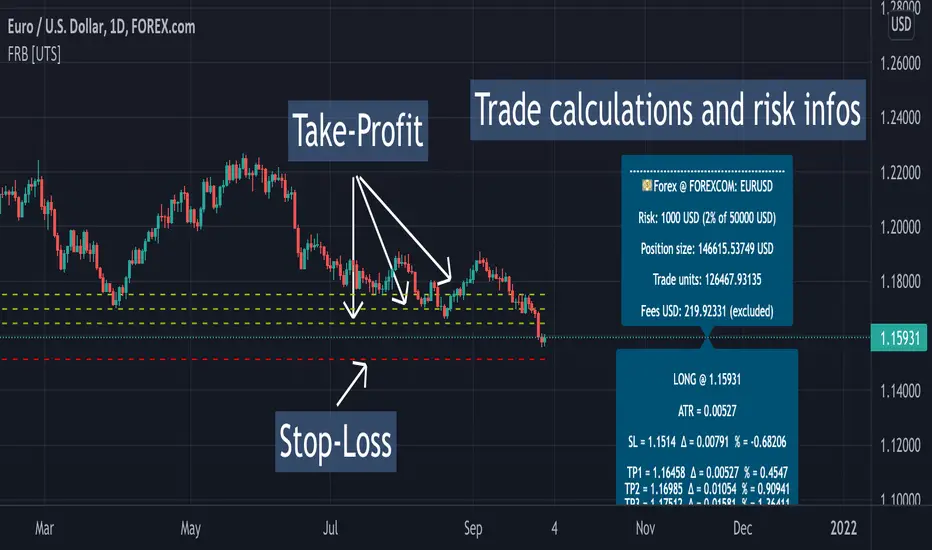
Forex Risk Buddy - Lite: Position Size, SL & TP System [UTS]Forex Risk Buddy - Lite
Position Size, Stop Loss & Take Profit System
The ultimate system to calculate trading risk on forex markets.
The 'Lite' version is limited to the EUR/USD forex trading pair.
💵 Forex
Position Sizing
De-risk possible drawdown by calculating a proper position size.
Define your risk percent based on your net value
Freely define your account currency
Trade any asset by the customizable Base / Quote currency factor
Calculate trading fees
Show all information on a customizable data screen
Stop Loss
Minimize trade risk by calculating your stop-loss.
Percent, Value and Delta display from current price
ATR based (Average True Range, modifiable)
Custom SL value possible
Adjustable
Two visual representations on chart
Automatically and real-time calculated on screen
Take Profit
Multiple take-profit levels to ensure not giving back to the market.
Up to 3 take profit levels to define
ATR based (Average True Range, modifiable)
Custom TP values possible
Easily customizable
Two visual representations on chart
Automatically and real-time calculated on screen
Currencies
Choose an account currency and calculate your risk for every trading pair.
USD
EUR
GBP
AUD
CAD
CHF
HKD
JPY
NOK
NZD
RUB
SEK
SGD
TRY
ZAR
BTC (crypto)
ETH (crypto)
USDT (crypto)
BUSD (crypto)
USDC (crypto)
Forex Risk Buddy: Position Size, SL & TP System [UTS]Forex Risk Buddy
Position Size, Stop Loss & Take Profit System
The ultimate system to calculate trading risk on forex markets.
💵 Forex
Position Sizing
De-risk possible drawdown by calculating a proper position size.
Define your risk percent based on your net value
Freely define your account currency
Trade any asset by the customizable Base / Quote currency factor
Calculate trading fees
Show all information on a customizable data screen
Stop Loss
Minimize trade risk by calculating your stop-loss.
Percent, Value and Delta display from current price
ATR based (Average True Range, modifiable)
Custom SL value possible
Adjustable
Two visual representations on chart
Automatically and real-time calculated on screen
Take Profit
Multiple take-profit levels to ensure not giving back to the market.
Up to 3 take profit levels to define
ATR based (Average True Range, modifiable)
Custom TP values possible
Easily customizable
Two visual representations on chart
Automatically and real-time calculated on screen
Currencies
Choose an account currency and calculate your risk for every trading pair.
USD
EUR
GBP
AUD
CAD
CHF
HKD
JPY
NOK
NZD
RUB
SEK
SGD
TRY
ZAR
BTC (crypto)
ETH (crypto)
USDT (crypto)
BUSD (crypto)
USDC (crypto)
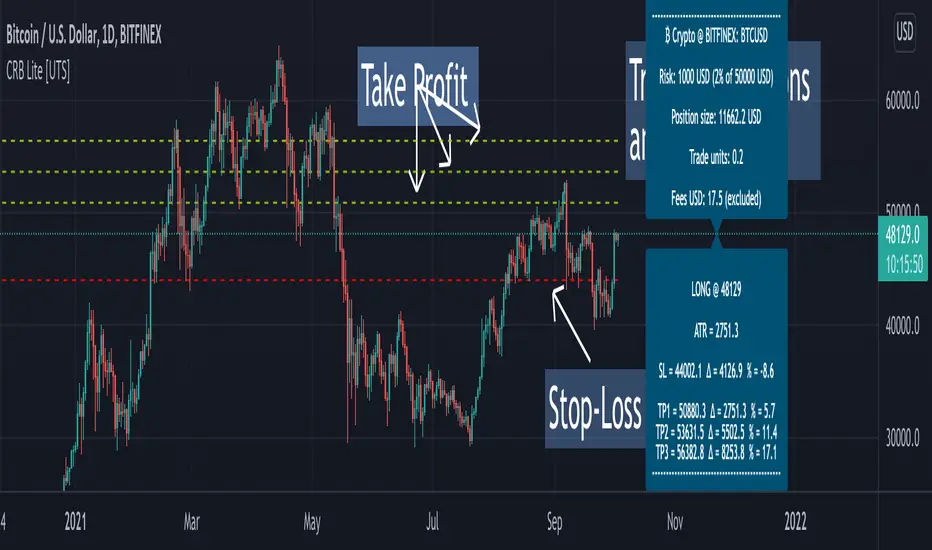
Crypto Risk Buddy - Lite: Position Size, SL & TP System [UTS]
Crypto Risk Buddy - Lite
Position Size, Stop Loss & Take Profit System
The ultimate system to calculate trading risk on crypto assets.
The 'Lite' version is limited to BTC as base currency.
₿ Cyptocurrencies
Position Sizing
De-risk possible drawdown by calculating a proper position size.
Define your risk percent based on your net value
Freely define your account currency
Trade any asset by the customizable Base / Quote currency factor
Calculate trading fees
Show all information on a customizable data screen
Stop Loss
Minimize trade risk by calculating your stop-loss.
Percent, Value and Delta display from current price
ATR based (Average True Range, modifiable)
Custom SL value possible
Adjustable
Two visual representations on chart
Automatically and real-time calculated on screen
Take Profit
Multiple take-profit levels to ensure not giving back to the market.
Up to 3 take profit levels to define
ATR based (Average True Range, modifiable)
Custom TP values possible
Easily customizable
Two visual representations on chart
Automatically and real-time calculated on screen
Currencies
Choose an account currency and calculate your risk for every trading pair.
USD
EUR
GBP
AUD
CAD
CHF
HKD
JPY
NOK
NZD
RUB
SEK
SGD
TRY
ZAR
BTC (crypto)
ETH (crypto)
USDT (crypto)
BUSD (crypto)
USDC (crypto)
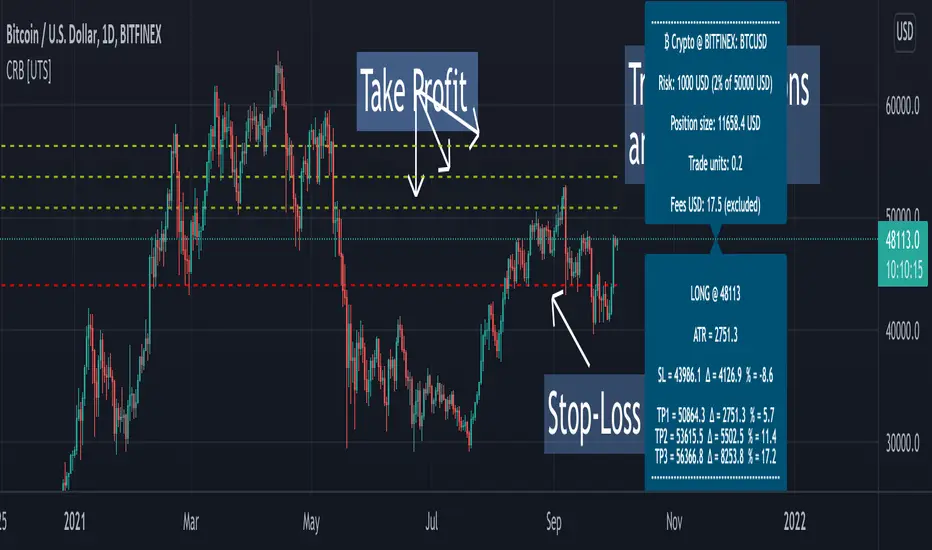
Crypto Risk Buddy: Position Size, SL & TP System [UTS]
Crypto Risk Buddy
Position Size, Stop Loss & Take Profit System
The ultimate system to calculate trading risk on crypto assets.
₿ Cyptocurrencies
Position Sizing
De-risk possible drawdown by calculating a proper position size.
Define your risk percent based on your net value
Freely define your account currency
Trade any asset by the customizable Base / Quote currency factor
Calculate trading fees
Show all information on a customizable data screen
Stop Loss
Minimize trade risk by calculatig your stop-loss.
Percent, Value and Delta display from current price
ATR based (Average True Range, modifiable)
Custom SL value possible
Adjustable
Two visual representations on chart
Automatically and real-time calculated on screen
Take Profit
Multiple take-profit levels to ensure not giving back to the market.
Up to 3 take profit levels to define
ATR based (Average True Range, modifiable)
Custom TP values possible
Easily customizable
Two visual representations on chart
Automatically and real-time calculated on screen
Currencies
Choose an account currency and calculate your risk for every trading pair.
USD
EUR
GBP
AUD
CAD
CHF
HKD
JPY
NOK
NZD
RUB
SEK
SGD
TRY
ZAR
BTC (crypto)
ETH (crypto)
USDT (crypto)
BUSD (crypto)
USDC (crypto)
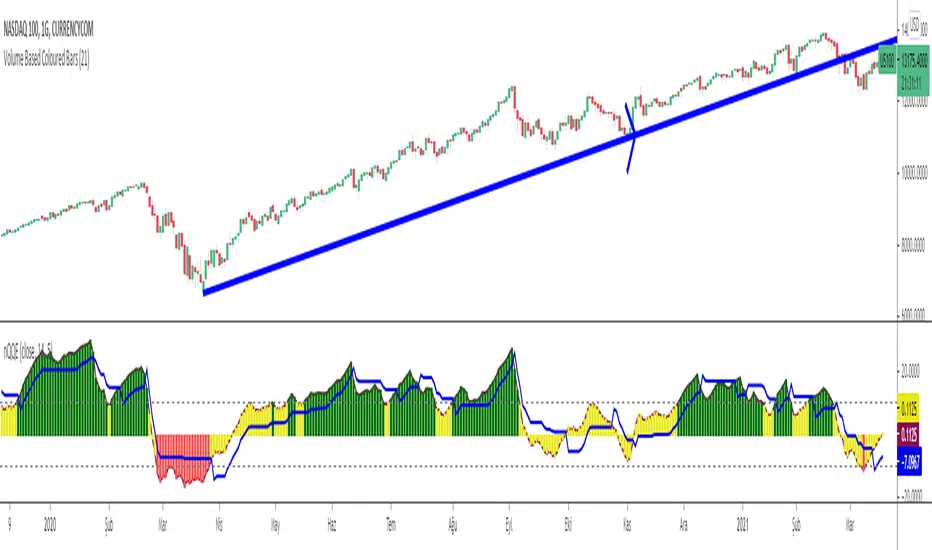
Normalized Quantitative Qualitative Estimation nQQENormalized version of Quantitative Qualitative Estimation QQE:
Normalized QQE tries to overcome the problems of false signals due to RSI divergences on the original QQE indicator.
The main purpose is to determine and ride the trend as far as possible.
So users can identify:
UPTREND : when nQQE Histogram is GREEN (nQQE is above 10)
DOWNTREND : when nQQE Histogram is RED (nQQE is below -10)
SIDEWAYS: when nQQE Histogram is YELLOW (nQQE is between -10 and 10)
Calculation is very simple;
RSI based QQE oscillates between 0-100
nQQE is simply calculated as:
nQQE=QQE-50
to make the indicator fluctuate around 0 level to get more accurate signals.
Various alarms added.
Kıvanç Özbilgiç
Renko + CandlesThis indicator has been designed to show you both candle chart and Renko chart in one place.
I think most of you are familiar with candle chart which is working with the time and price movements but Renko chart is based on price differences and is not related to the "time" parameter.
so if you see a Renko brick is appear up(or down) to the previous brick it means that a certain and fixed price movement has been occurred (which mostly calculate by ATR). and also this indicator works in any time frame.
Remember because we want both charts we have time parameter in this indicator, and if the price doesn't move up or down a certain percentage from previous bars, it will plot a renko bar beside the previous one.
you can use this indicator to see if the price moves up or down.
Or you can determine the important support and resistances with much less noises.
it can be used as a confirmation for you to keep your positions or exit.
go ahead and discover it...
If you have any questions, don't hesitate! ask in the comments section below.

Quantitative Qualitative Estimation QQE
The QQE indicator is a momentum based indicator to determine trend and sideways.
The Qualitative Quantitative Estimation (QQE) indicator works like a smoother version of the popular Relative Strength Index (RSI) indicator. QQE expands on RSI by adding two volatility based trailing stop lines. These trailing stop lines are composed of a fast and a slow moving Average True Range (ATR). These ATR lines are smoothed making this indicator less susceptible to short term volatility.
The most common method of using QQE is to look for crosses of the fast and slow moving trailing stop lines during periods when the QQE line reflects overbought or oversold conditions
Qualitative Quantitative Estimation made up of a smoothed Relative Strength Index (RSI) indicator plus fast and slow volatility-based trailing levels.
Qualitative Quantitative Estimation can be used in two directions:
1.Determine the trend, i.e. if the line is above the 50 level, the trend is ascending, if below - descending;
2.Search for signals at the moment of crossing of the QQE FAST (maroon) and QQE SLOW (blue) lines.
The QQE itself is generally considered to indicate an up-trend ifQQE FAST is above QQE SLOW, and a down-trend if below QQE SLOW.
Often a middle-range between 40 and 60 is set and if the indicator is in that range, then the market is considered to be tracking sideways, or in no trend.
You will need to set only one parameter – “SF” "RSI SMoothing Factor", an analogue of the period in RSI.
By the way, judging from the open source information, the algorithm used the standard strength index with a period of 14 for calculations.
Various signals can be created from the indicator such as:
-Buy when QQE FAST crosses above QQE SLOW below 50 level or just buy when QQE lines crosses above 50 level.
-Sell when QQE FAST crosses below QQE SLOW above 50 level or just sell when QQE lines crosses below 50 level.
WARNING: QQE IS A RSI BASED INDICATOR SO THAT IT CAN TRIGGER FALSE SIGNALS DURING DIVERGENCES!
Kıvanç Özbilgiç

Position SizingATR based position sizing calculator that takes into account the capital, risk percentage and commissions to be paid. Color changes to green as the affordable position size significantly increases relative to recent history.
EMA with RSI Backed Divergence BandsEMA200 with bands around it showing the effect of changes in RSI scaled by ATR . When the filling is green it indicates the bullish momentum and bearish when it is red.
