Momentum ChecklistMomentum Checklist - Visual Trading Dashboard
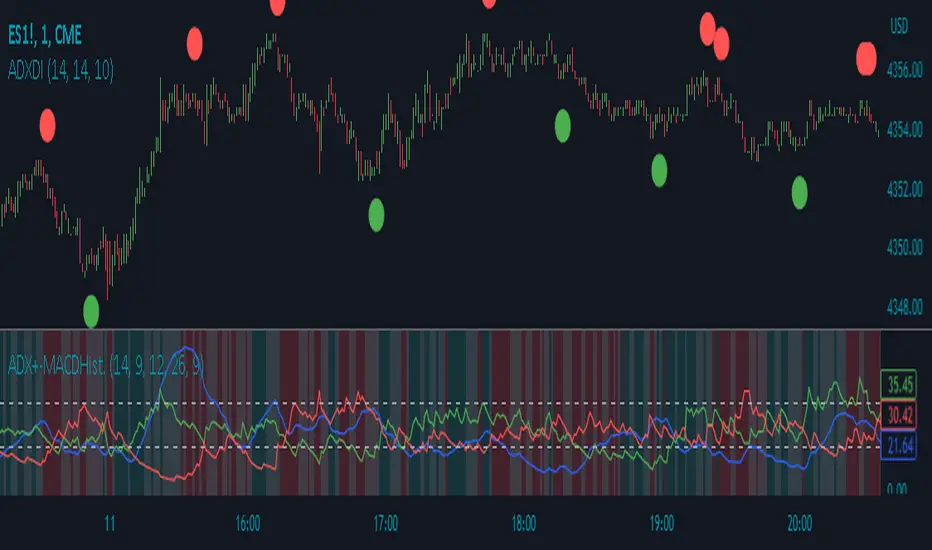
A clean, easy-to-read dashboard that displays key momentum indicators in one convenient table. This indicator helps traders quickly determine the directional bias of price action by combining ADX, Directional Movement Index (DMI), and Money Flow Index (MFI).
What It Shows:
ADX (Average Directional Index): Measures trend strength. Green checkmark appears when ADX ≥ 20, indicating a strong trending market
DI+ (Positive Directional Indicator): Tracks upward price movement
DI- (Negative Directional Indicator): Tracks downward price movement
MFI (Money Flow Index): Volume-weighted momentum indicator. When > 50 indicates bullish money flow
Bias: Automatically calculates directional bias:
LONG: When DI+ > 25 and DI- < 20
SHORT: When DI- > 25 and DI+ < 20
NEUTRAL: When conditions are mixed
Trading Strategy:
This indicator helps determine the bias of price movement in a certain direction. When coupled with Bollinger Bands, it becomes a very powerful combination to catch those big explosive moves up or down. The momentum confirmation from this checklist combined with Bollinger Band squeezes or breakouts can significantly improve entry timing.
Recommended Usage:
Timeframes: 5-minute to 15-minute charts for optimal performance
Best Assets: US30, XAUUSD (Gold), BTCUSD, and most major indices
Works exceptionally well on volatile instruments with strong directional moves
Features:
Color-coded cells for instant visual confirmation
Customizable position (Top Right, Top Left, Bottom Right, Bottom Left)
Adjustable text size (Tiny, Small, Normal)
Configurable ADX, DMI, and MFI period settings
Perfect for day traders and scalpers looking for quick momentum confirmation before entering trades! Feel free to adjust any part of this description to match your style! 🎯
Indikator Pine Script®