[RS]Fractal Levels V1EXPERIMENTAL: update to previous version, added a average of the fractal levels and the ability to hide the diferent components.Indikator Pine Script®oleh RicardoSantosDiupdate 33959
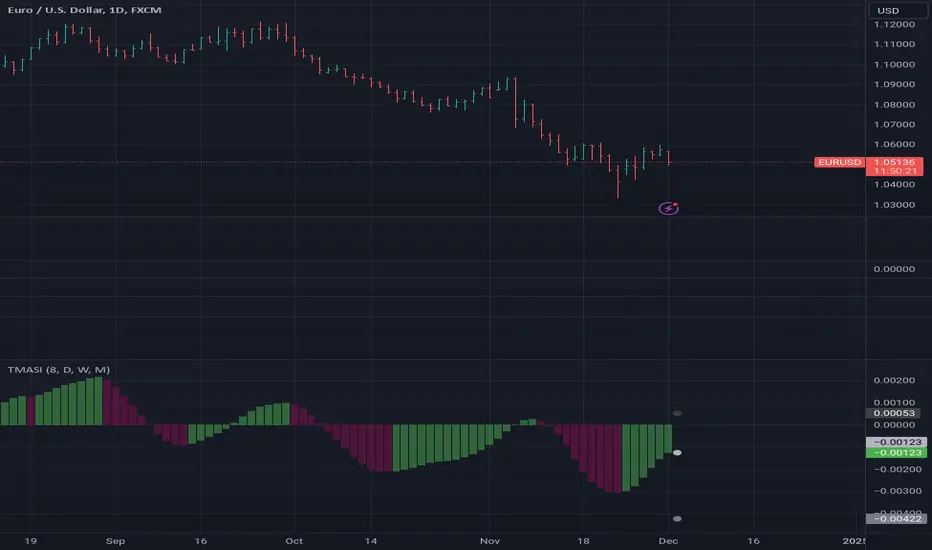
[RS]Triangular Moving Average Slope Indicator V1request for ChartArt: using swma() builtin function, for the function unsmoothed output just set length to 1.Indikator Pine Script®oleh RicardoSantosDiupdate 66209
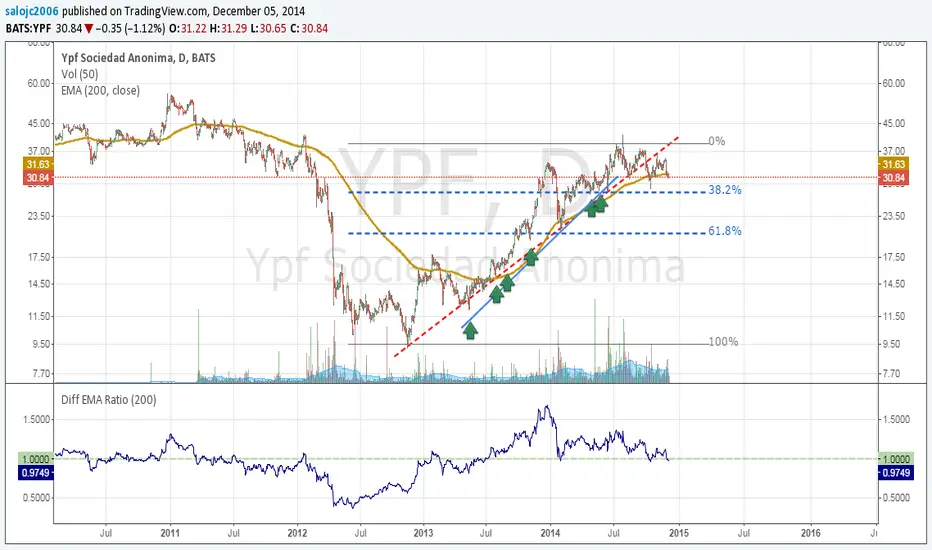
DIFF EMA RATIOThis indicator shows how far the price of your EMA isIndikator Pine Script®oleh salojc20061111269
CM ATR Stops/Bands - Multi-TimeFrameCM_MTF ATR Bands/Stops Many Options Available Via Input Tab: -Chart Defaults to Upper and Lower ATR's Based on Current Chart TimeFrame -Ability to Plot either Upper and/or Lower ATR's -Ability to Change the Time Frame ATR's are Based On! -Ability to change Look Back Period and ATR Multiplier Individually for Both Time Frames -This Gives you the ability to plot same Time Frame with (for ex.) a 5 ATR with a 1.5 Mult and a 14 ATR with a 2.0 Mult etc. -Or you can plot Daily ATR's on a 60 minute Chart etc. -ATR Multipliers are Calculated with Code that allows "Non Whole Numbers" Allowing Ability to use 1.5 ATR's, 1.8 ATR's etc. ***Endless # of Combinations can be used!!!!Indikator Pine Script®oleh ChrisMoody1212 1.9 K
[RS]Cumulative Average Price Gridgrid based on the cumulative average price. on a sidenote: looks like im baned from chat for a week.Indikator Pine Script®oleh RicardoSantosDiupdate 1010206
[RS]Cumulative Average PriceCumulative average price edit: forgot about hidden tools, study is black average price lineIndikator Pine Script®oleh RicardoSantos78
Madrid Moving AverageThis plots the moving averages, either exponential or standard. When it is declining it shows the MA in red, green when rising. Trading MA: Bullish when it is rising, Bearish when it is fallingIndikator Pine Script®oleh Madrid 1.4 K
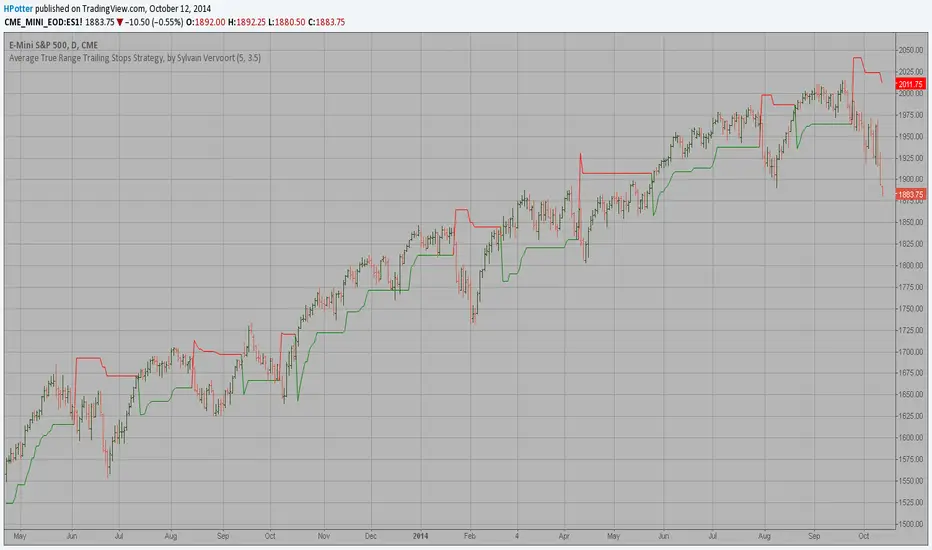
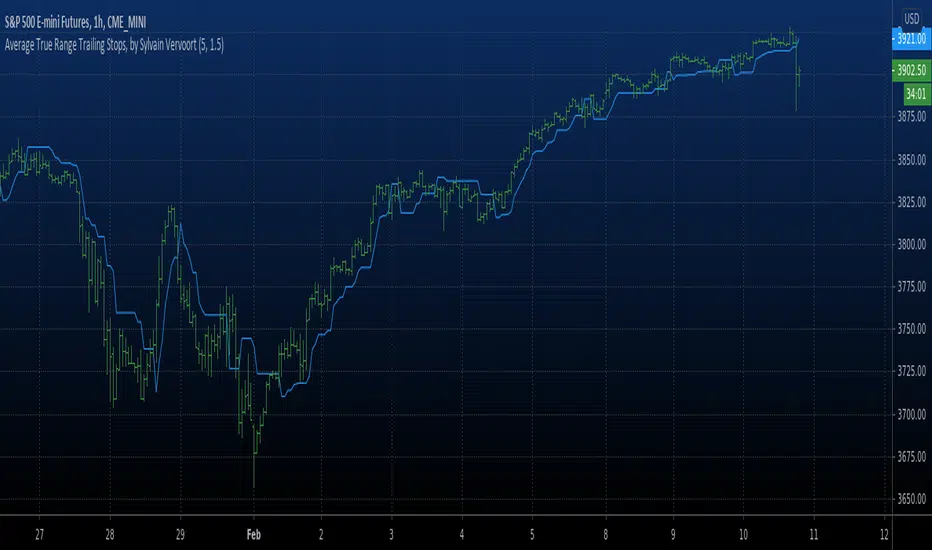
Average True Range Trailing Stops ColoredAverage True Range Trailing Stops Strategy, by Sylvain Vervoort The related article is copyrighted material from Stocks & Commodities Jun 2009 Indikator Pine Script®oleh HPotter3030 4.3 K
Average True Range Trailing Stops, by Sylvain Vervoort Average True Range Trailing Stops, by Sylvain Vervoort The related article is copyrighted material from Stocks & Commodities Jun 2009 Indikator Pine Script®oleh HPotterDiupdate 2020 2 K
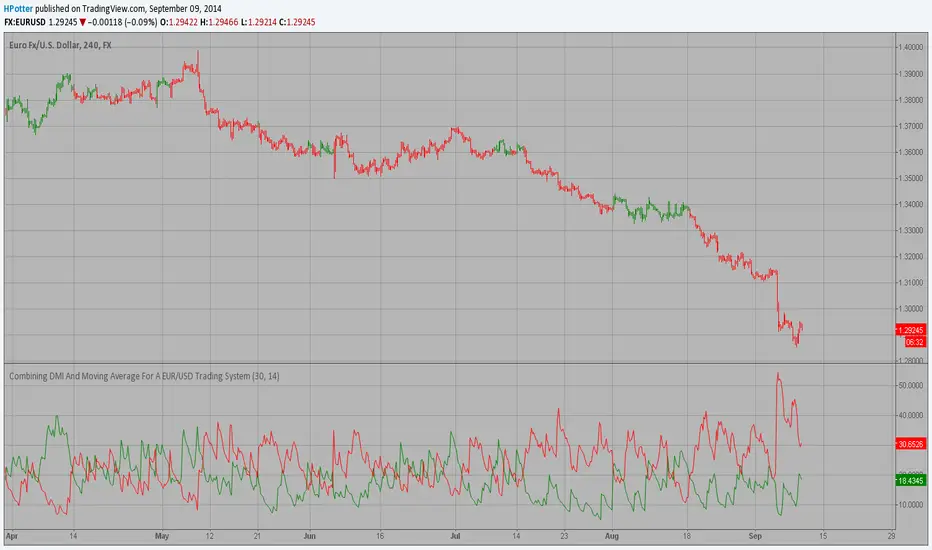
Combining DMI And Moving Average For A EUR/USD Trading SystemCombining DMI And Moving Average For A EUR/USD Trading System, by Rombout Kerstens The related article is copyrighted material from Stocks & Commodities Aug 2009 Indikator Pine Script®oleh HPotter33391
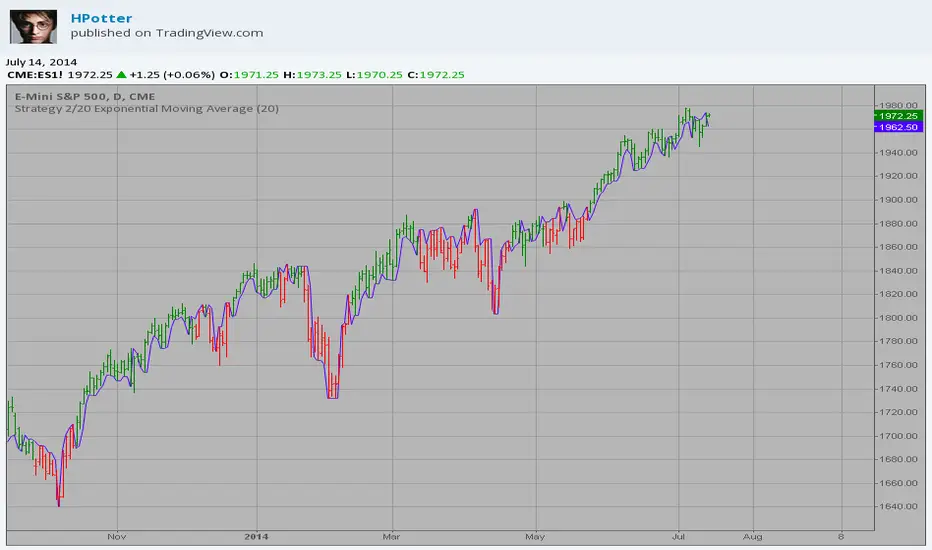
Strategy 2/20 Exponential Moving Average Strategy. This indicator plots 2/20 exponential moving average. For the Mov Avg X 2/20 Indicator, the EMA bar will be painted when the Alert criteria is met. You can use in the xPrice any series: Open, High, Low, Close, HL2, HLC3, OHLC4 and ect... Indikator Pine Script®oleh HPotter672
2/20 Exponential Moving Average This indicator plots 2/20 exponential moving average. For the Mov Avg X 2/20 Indicator, the EMA bar will be painted when the Alert criteria is met. You can use in the xPrice any series: Open, High, Low, Close, HL2, HLC3, OHLC4 and ect...Indikator Pine Script®oleh HPotter22959
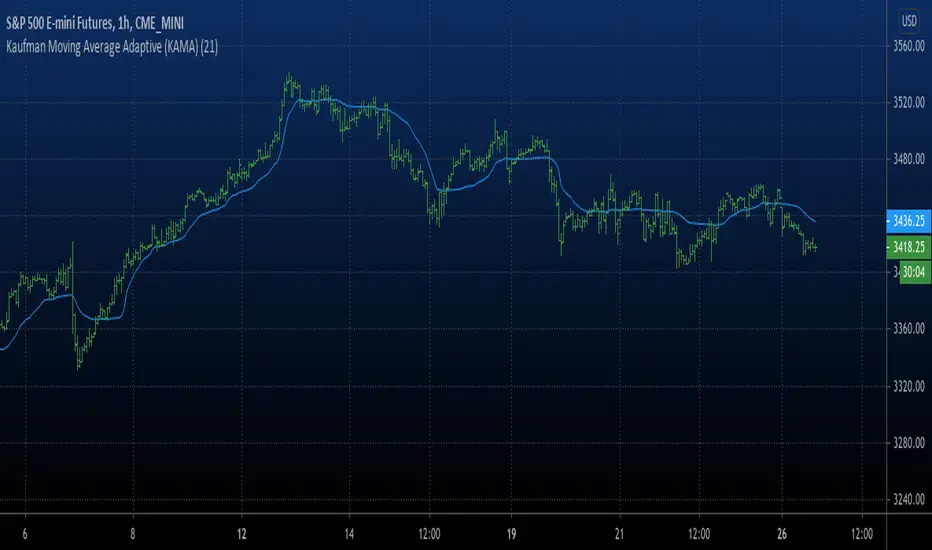
Kaufman Moving Average Adaptive (KAMA) Everyone wants a short-term, fast trading trend that works without large losses. That combination does not exist. But it is possible to have fast trading trends in which one must get in or out of the market quickly, but these have the distinct disadvantage of being whipsawed by market noise when the market is volatile in a sideways trending market. During these periods, the trader is jumping in and out of positions with no profit-making trend in sight. In an attempt to overcome the problem of noise and still be able to get closer to the actual change of the trend, Kaufman developed an indicator that adapts to market movement. This indicator, an adaptive moving average (AMA), moves very slowly when markets are moving sideways but moves swiftly when the markets also move swiftly, change directions or break out of a trading range. Indikator Pine Script®oleh HPotterDiupdate 3131 4.1 K
DAPD - Daily Average Price Delta This indicator is similar to Bollinger Bands. It based on DAPD - Daily Average Price Delta. DAPD is based upon a summation for each of the highs (hod) for the 21 days prior to today minus the summation for each of the lows (lod) for the last 21 days prior to today. The result of this calculation would then be divided by 21. Indikator Pine Script®oleh HPotter11187
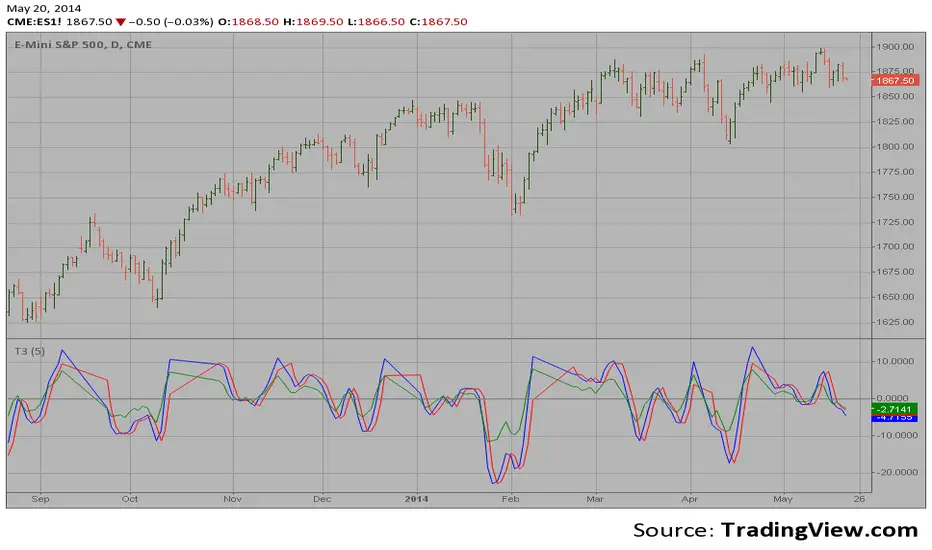
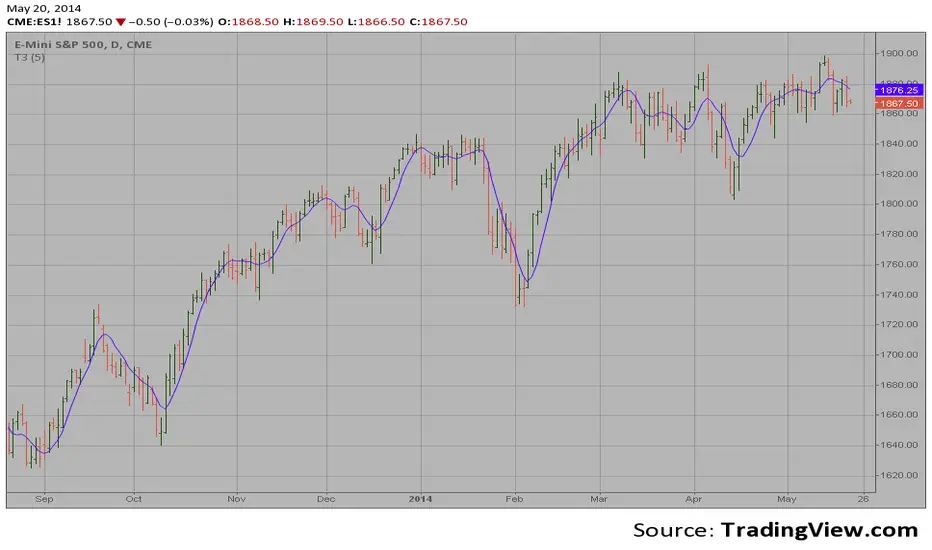
T3 3 Averages This function is an Pine version of the moving average described in the January, 1998 issue of S&C magazine, p.57, "Smoothing Techniques for More Accurate Signals", by Tim Tillson. It is translated from the MetaStock code presented in the article. The function uses a version of the XAverage, written by me, which allows variables as inputs. The most popular method of interpreting a moving average is to compare the relationship between a moving average of the security's price with the security's price itself (or between several moving averages). Indikator Pine Script®oleh HPotter1010136
T3 Average This indicator plots the moving average described in the January, 1998 issue of S&C, p.57, "Smoothing Techniques for More Accurate Signals", by Tim Tillson. This indicator plots T3 moving average presented in Figure 4 in the article. T3 indicator is a moving average which is calculated according to formula: T3(n) = GD(GD(GD(n))), where GD - generalized DEMA (Double EMA) and calculating according to this: GD(n,v) = EMA(n) * (1+v)-EMA(EMA(n)) * v, where "v" is volume factor, which determines how hot the moving average’s response to linear trends will be. The author advises to use v=0.7. When v = 0, GD = EMA, and when v = 1, GD = DEMA. In between, GD is a less aggressive version of DEMA. By using a value for v less than1, trader cure the multiple DEMA overshoot problem but at the cost of accepting some additional phase delay. In filter theory terminology, T3 is a six-pole nonlinear Kalman filter. Kalman filters are ones that use the error — in this case, (time series - EMA(n)) — to correct themselves. In the realm of technical analysis, these are called adaptive moving averages; they track the time series more aggres-sively when it is making large moves. Tim Tillson is a software project manager at Hewlett-Packard, with degrees in mathematics and computer science. He has privately traded options and equities for 15 years. Indikator Pine Script®oleh HPotter1515658