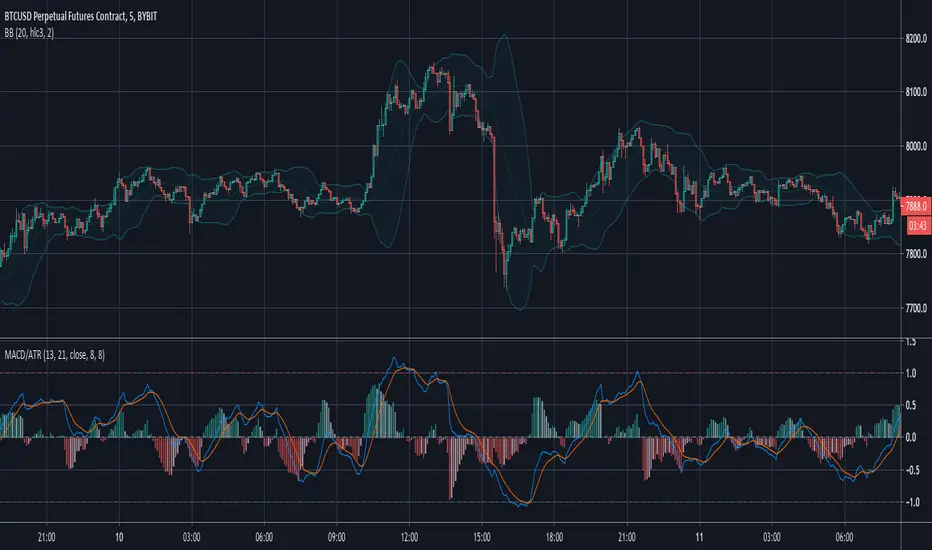
MACD/ATRThis indicator is a restricted MACD .
I reached this with a little trick: I devided it by ATR . This way it is most of the time inside the -1..1 range. It depends on the length of the ATR's period. If it is greater, the probability of outliers is greater.
With this indicator you can use cerain levels of MACD and its histogram as a trigger.
Share with me if you found it useful.
ATR
[mya] ATR FilteredATR Filtered for NNFX trading.
A classic Average True Range (ATR) indicator with a simple feature to filter out the spikes.
The ATR value is the tool to determine your TP and SL on daily time-frame, specifically in the NNFX way of trading.
VP mentions in his podcast that when the ATR spikes up you have 2 options: 1. wait 14 candles for the ATR to normalize, 2. use the ATR value prior to the spike.
ATR spikes are easy to spot (thus easy to exclude) for an itraday flash crash.
On the other hand when volatility increases over several candles (as in the Covid-19 shock) it can be difficult to determine which ATR value to base your TP/SL on.
In definition of standard deviation, 95.4% of the value will fall within the 2 sigma bands. Therefore the rest 4.6% can be filtered out as an extreme value (a spike).
The ATR in this indicator will plot the standard ATR value in normal condition, then when the ATR spike happens it will stay at the highest value at the point, when the ATR exceeded its 2 sigma band.
The filtering will reset when the ATR comes back down below the extended highest value.
*Disclaimer: Use at your own risk. I am not a programmer, just another guy trying to beat this game. Let's go get it.

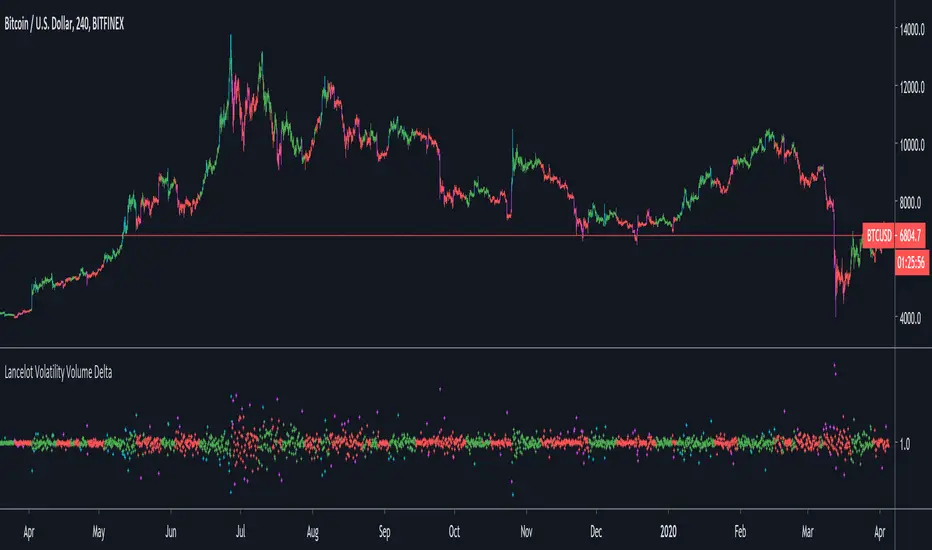
Lancelot Volatility Volume DeltaThis indicator calculate the delta of the volatility adjusted on-balance volume.
This could be use as a filter or trigger in a system.
Chonky ATR LevelsChoose any custom ATR settings (smoothing, period, time frame, lookback)
and project daily high/low with current daily high/low values

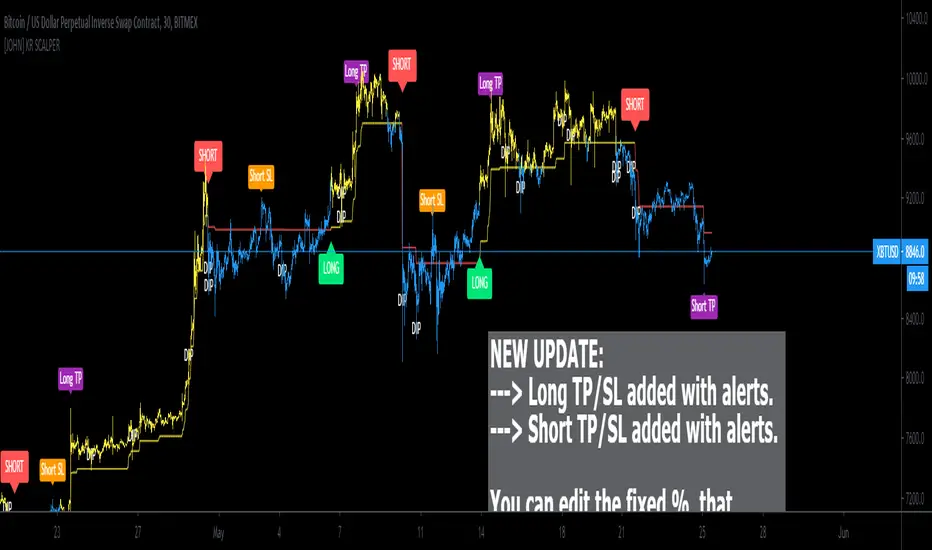
[JOHN] KR SCALPERHello this is KR SCALPER indicator. (work on crypto market)
---------------------------------
How this indicator work?
KR SCALPER script work with bollinger bands, price volatility and ATR (average true range).
This system provide
- HIGH QUALITY BUY/SELL Signals with a reasonable ROI.
- DIPS noted on chart with "DIP" TEXT, thanks to the use of bbands parameters.
- Work in cryptocurrency market, tested with top 10 coins, with good results.
- Tested on LTF (from 5m to 1h), work even on 4h, 1d.
How use it?
Indicator is setup for cryptocurrency. You can long and short by following the indications below:
GREEN LABEL = LONG
RED LABEL = SHORT
DIP noted on chart
This system write on chart with "DIP" text whenever a decrease of price/selloff occour, usually a good place to make attention if you are looking for a trade.
This is possible with the use of Bbands that helped me on this add.
Below some timeframes examples.
5 minute chart
15 minute chart
1H timeframe chart
4H timeframe chart
Below ETH USD 4H timeframe chart for reference.
----------------------------------
I hope you like and enjoy.
Good trading traders!
[HM] VWAP Envelope dinamic intraday v1- VWAP, volume weighted average price;
- Plus Envelope bands:
1) Dinamic, adjusted by volatility:
- - - daily ATR or
- - - daily Standard Deviation
2) or simple fixed % increments bands, defined by user.
# Intraday timeframe only.
# If volume data is absent, the indicator will not work at all.
Hope this could help the community.

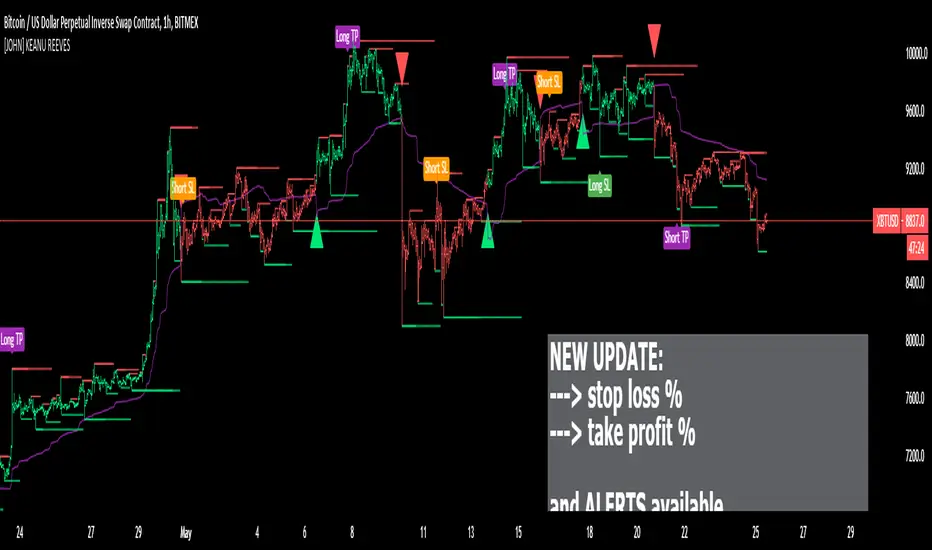
[JOHN] KEANU REEVESHello this is KEANU REEVES indicator. (Ideal for crypto)
---------------------------------
How this indicator work?
KEANU REEVES work with ATR, integrated with high and low system.
Support/resistance area as high/low. Check the images below.
This system provide high profitable signal with every pair and coins, with all timeframes.
Below last daily signal ROI
BITCOIN
ETH ROI
Some other timeframes WEEKLY AND H4 Bitcoin chart
Some other exmple EOS and ETH other perspective (different parameters)
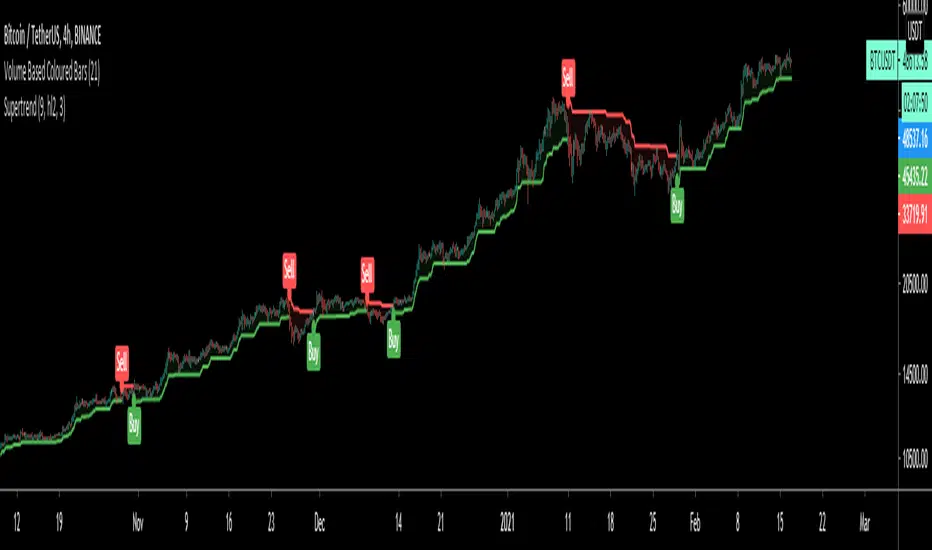
SuperTrendSuperTrend is one of the most common ATR based trailing stop indicators.
In this version you can change the ATR calculation method from the settings. Default method is RMA, when the alternative method is SMA.
The indicator is easy to use and gives an accurate reading about an ongoing trend. It is constructed with two parameters, namely period and multiplier. The default values used while constructing a superindicator are 10 for average true range or trading period and three for its multiplier.
The average true range (ATR) plays an important role in 'Supertrend' as the indicator uses ATR to calculate its value. The ATR indicator signals the degree of price volatility.
The buy and sell signals are generated when the indicator starts plotting either on top of the closing price or below the closing price. A buy signal is generated when the ‘Supertrend’ closes above the price and a sell signal is generated when it closes below the closing price.
It also suggests that the trend is shifting from descending mode to ascending mode. Contrary to this, when a ‘Supertrend’ closes above the price, it generates a sell signal as the colour of the indicator changes into red.
A ‘Supertrend’ indicator can be used on equities, futures or forex, or even crypto markets and also on daily, weekly and hourly charts as well, but generally, it fails in a sideways-moving market.
I had converted Supertrend indicator code for various platforms like Metastock in 2017, but in this TradingView version special credit goes to everget - Alex Orekhov which gave a great inspiration to look my indicators better with highlights, signals and alarms. Thank you Alex.
[C] Dynamic Range Channel based on ATR on Multi Time FramePlots the dynamic range from the calculated Average True Range of the security. The calculated price that it could return to from high to low and vice versa. Has been tested on multiple time frames on NSE equity stocks.

ADR price targets with alert options- UltimateADR based price targets with option to hide past levels..
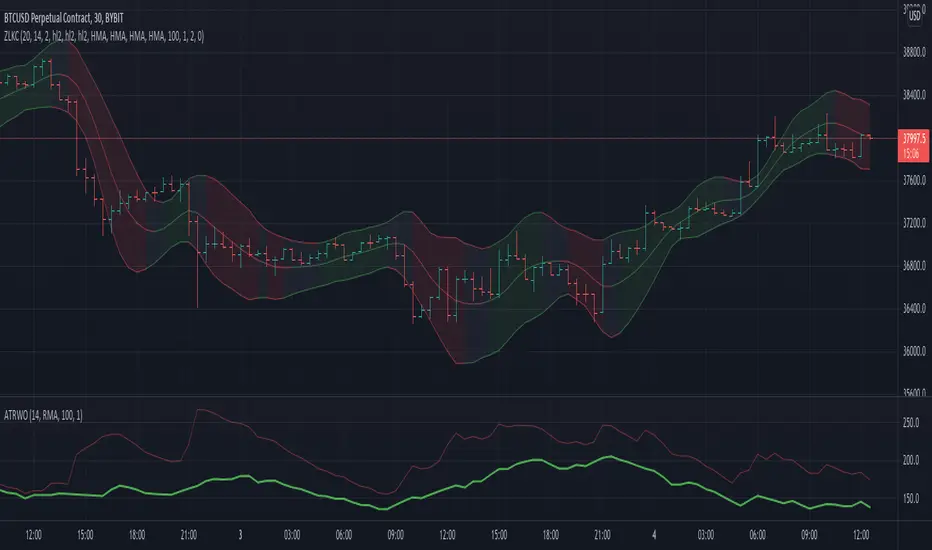
Zero Lag Keltner ChannelsThis is Keltner Channelz (KC) with Zero Lag Moving Average (ZLMA as base). It is smoother and has less lag than the original (EMA/SMA) variant.
It also can be used as a trend indicator and trend confirmation indicator. The upper and lower bands are green if it is an up trend, and red if a down trend. If both have the same color it is a stronger trend.
ATR based Stop and Take-Profit levels in realtime Little tool to quickly identify stops and take-profit levels based on Average True Range. User can change ATR multipiers, as well as the ATR length used. Green and red lines show these levels; plot is visible over last 8 bars only to reduce clutter. Label showing the current ATR, up above the last bar

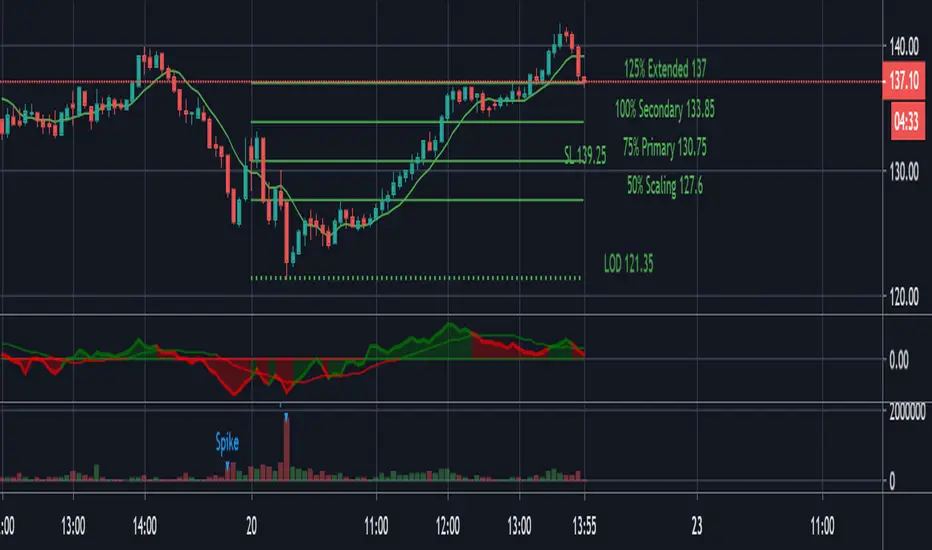
Advanced ADR - PivotBossThis Script comes straight from PivotBoss Masterclass. Script calculates compression and expansion of prices. ADR is calulated for user defined period and it is compared over 10 period. If the prices goes over 125% of average ADRin the look back period then current price is over expanded and reversal is in the corner. When Prices falls below 65% of average ADR then prices are under compression. Then you should look to position yourself in the direction of the expansion.
Expansion leads to compression. Compression leads to Expansion

UT Bot AlertsUT Bot indicator was initially developer by @Yo_adriiiiaan
The idea of original code belongs @HPotter
These are v4 alerts for my previously published strategy:
Original script:

Cryptohopper ATRThe Cryptohopper ATR analyses the volatility of the asset. When the market is rather ranging, the volatility remains low and the ATR line decreases . However, when the market starts moving quickly in one direction, doesn’t matter if it’s up or down, the ATR will start rising.
It can be a very good indicator to spot when the big investors are entering the market to buy or sell.
We have added a moving average of the ATR line to generate signals. In this way, when volume starts flooding the market and the volatility peaks, the ATR line will rise above its moving average. Likewise, when the volatility falls and the market ranges, the ATR line will fall below its moving average.
Last but not least , unlike with other indicators, the ATR does not generate buy or sell signals since it measures the volatility of the market. Therefore, the price can be going up or down.
Then, how can you use this indicator in your automated strategy? It can be described as a volatility filter . When the ATR line goes above the moving average, the market is more volatile and the price is moving, then the ATR will let another indicator(s) to give a buy or sell signal. However, when the volatility is low and the price is ranging, the ATR is below its moving average, and it won’t let another indicator(s) to give any buy or signal.
Therefore, it filters out trades when the market volatility is low and the price doesn’t move much and let your strategy trade when the market is volatile and the price is trending.
--
As you can see in the chart, when the ATR line (orange line) is below the blue line, the price is not volatile and it is likely to be ranging. On the other hand, when the ATR line is above the blue one, the volatility of the market is increasing, which means that the price is initiating a new trade and there will be more trading opportunities.

[KICK] Volatility HeatmapWith this indicator you can gauge the price volatility of an instrument across multiple timeframes in a very compact visualization. It allows you to find critically low areas of volatility and predict the likelihood of an imminent move or the conclusion of a move. While you can do this with other indicators, it is often easy to miss low volatility on timeframes that you don't normally survey.
Features:
Measure volatility using either Average True Range Percentile Rank (ATR-PR) or Historical Volatility Percentile (HVP)
Measure volatility from any other source (e.g. Volume, or custom series from another indicator) using HVP
2 Rendering Modes (Smooth and Distinct) as seen in the sample chart above
Ability to show current timeframe Volatility in bar chart above the heatmap
Get alerts when a certain number of timeframe levels (configurable) are showing critically low volatility (implying imminent move)
Get an alert when the current timeframe volatility level emerges from a critically low volatility zone (usually indicating the start of a significant move)
The bands on the map are 1x, 2x, 3x, 5x, 8x, 13x, 21x, and 34x the curent timeframe. The volatility measurements go (from lowest to highest): Lime, Blue, Dark Purple -> Light Purple (gradient), Magenta, Pink. If you see grey blocks/bands, these indicate that the instrument you are using does not have enough historical data to determine the volatility based on your timeframe and reference period. For example, if you are using a reference period of 100 and are on the daily view, to render the bottom-most band (x34) you would need around 3400 days of data (over 9 years).
You can use this indicator in multiple ways. My favorite way personally is to look for areas that have multiple consecutive timeframes showing low volatility warnings and then enter when the highest of those timeframes turns back to purple. Use other methods, analysis, or indicators to determine direction (or just straddle P.A. with market stops). If I am scalping, then I will generally mostly watch the "current timeframe" and get alerts when it emerges from low volatility.
Use the link below to watch a tutorial video, request a trial, or purchase for access.

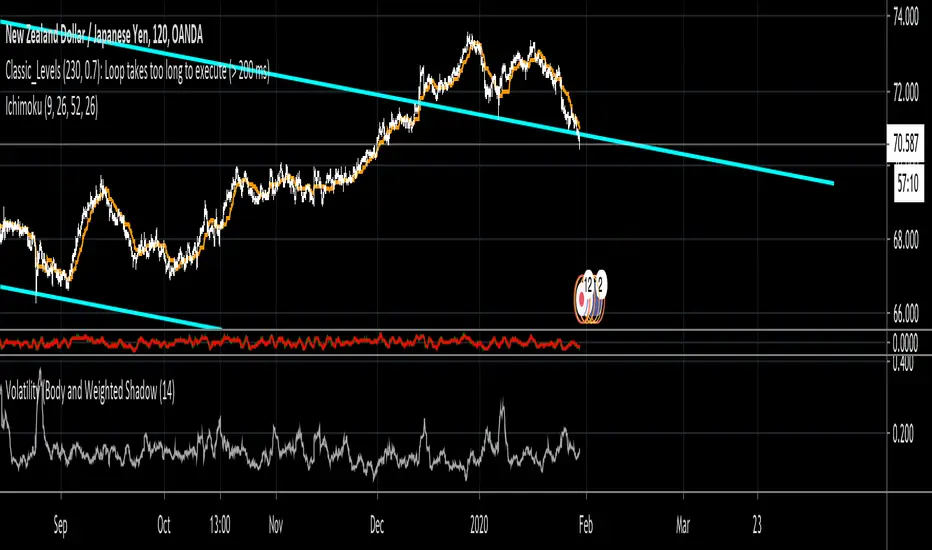
Volatility (Body and Weighted Shadow)- Volatility Indicator
- Replacement for ATR
- As each pair holds a different level of volatility, a stop loss can be set using this indicator rather than via a ratio 2:1, etc. e.g. 2 X Volatility Value = S/L...
- This indicator averages the bodies of candlesticks over a default length of 14 periods. It also considers the length of shadows via a weighted average. This is done as it is assumed that financial institutions tend to move price to levels that do not hold (shadows). Therefore, wick lengths are less significant than the candlestick bodies, so they are weighted to hold less value.
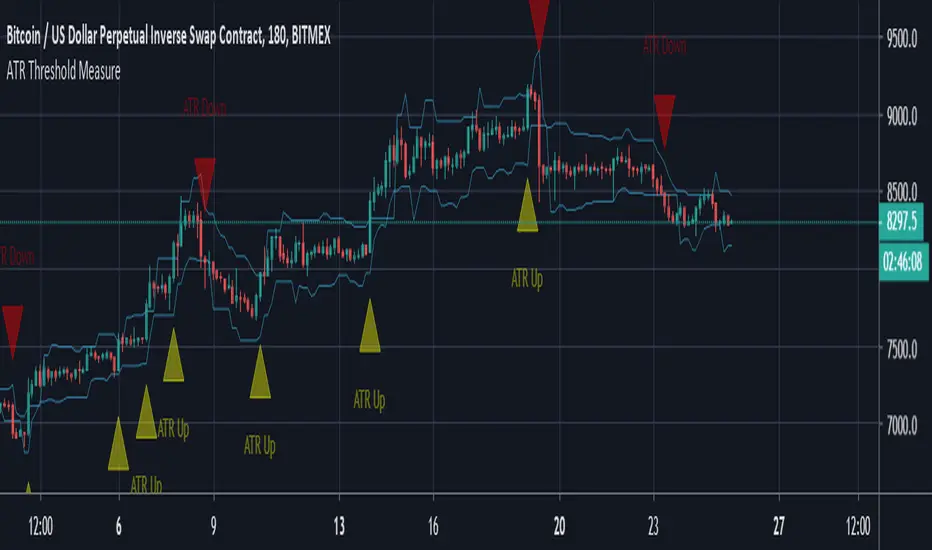
ATR Threshold MeasureATR Threshold Measure in short gives an alert when price closes below or above the ATR threshold lines shown on the chart.
Each plot for upper and lower threshold is based on the difference in price between the open and close of the last consecutive candle sequence then divided by the number of ATRs set by the indicator to verify if price has indeed closed above or below it. Setting alerts to bar candle close only will prevent false alerts mid candles.
A quick bearish example of this would be if you had 4 consecutive red candles. The indicator will take the open of the first candle of the sequence and subtract the current close value from the current candle. It will then take that difference and determine how many ATRs price has moved based on the ATR of the original candle in the sequence(Not the current ATR). If the close of the current candle exceeds the threshold set in the settings an alert is given to notify the user of an increase of volatility in the market in the opposite direction of trend or continuation of trend in a high volatility manner.
ATR x TP & SLSimple script based on ATR to calculate your Take Profit and Stop Loss
Input variables:
ATR Period ( Default: 14 )
TP Multiplier ( Default: 1*ATR )
SL Multiplier ( Default: 1.5*ATR )
SFL ATR BandsMany traders use ATR as a way to determine stop loss placement. It usually works like this:
- Stop loss for a short trade = high of last candle + ATR value
- Stop loss for a long trade = low of last candle – ATR value
This is an indicator that allows you to do just that: it gives you an easy way to view current and historical volatility using ATR-based price bands .
Features
The indicator is configurable with the following settings:
ATR period
ATR multiplier
ATR applied to highs/lows OR the close price
Bands offset
Only show for the last X candles
How To Use This Indicator
Since this indicator shows average volatility bands, it is a good measure of how much the price moves. So we can use ATR bands in a number of ways:
it’s an easy way to see where you can place your stop loss
you can use a multiple of ATR as your trade target
you can trail your stops alongside the ATR bands

Simple Moving Average - ATR Trailing StopThe old adage goes "Cut losers fast and let the winners run"
With this in mind, this will plot a dynamic trailing stop by subtracting any multiplier of the Average True Range (ATR) from the SMA of your choice.

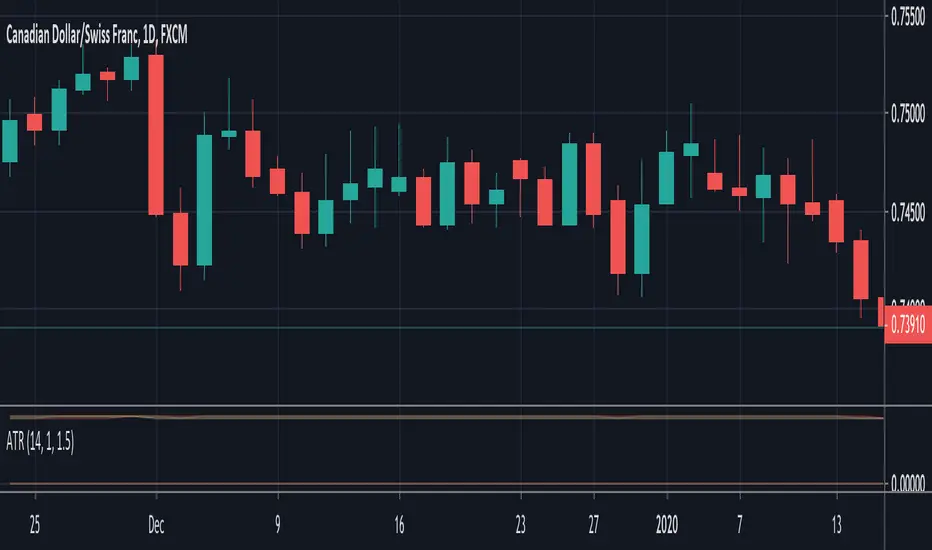
ATR [Gu5]ATR (Average True Range) by Sylvain Vervoort
In contrast to other ATR indicators, the line changes color when profits start
A diferencia de otros indicadores ATR, la linea cambia de color cunado empezamos a tomas ganancias

BEST Supertrend MAHello traders,
That one is an experiment
I was curious to see what a supertrend based on moving average cross could give
How does it work?
Bull event: fast moving average crossing over the slow moving average
Bear event: fast moving average crossing under the slow moving average
When the event is triggered, the script will plot the Supertrend as follow
UP Trend = ohlc4+ ATR * Factor
DOWN Trend = ohlc4- ATR * Factor
Interesting to see the results given by ohlc4 vs hl2 and hl3
Documentation: www.tradingview.com
This is an alternative of the classical Supertrend based on candle close being above/beyond the previous Supertrend level.
Hope you'll enjoy it and it will improve your trading making you a better trader
Dave
