OPEN-SOURCE SCRIPT
辰锋
// This Pine Script® code is subject to the terms of the Mozilla Public License 2.0 at mozilla.org/MPL/2.0/
// © chenfwng88888
//version=6
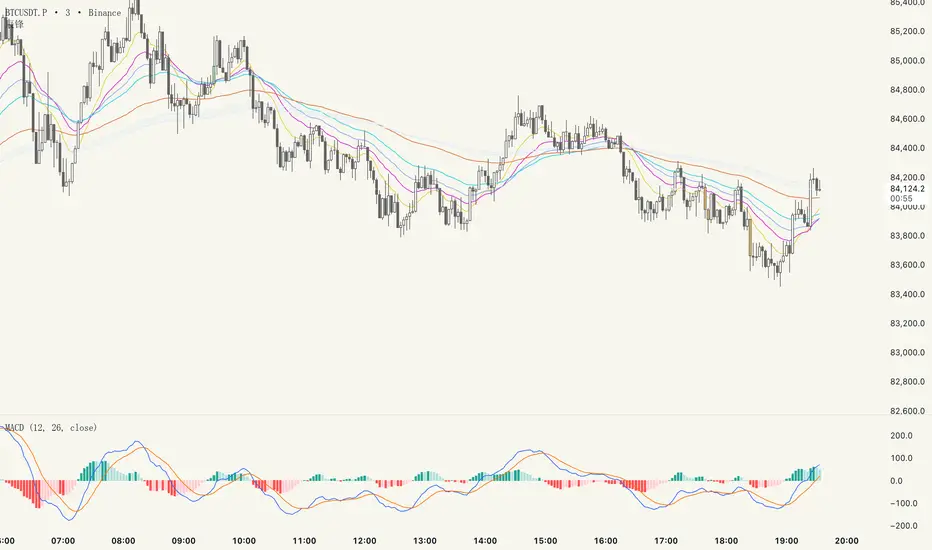
indicator("辰锋", shorttitle="辰锋", overlay=true)
// 关键EMA均线组
plot(ta.ema(close, 12), title="13", color=color.rgb(230, 202, 58), linewidth=1) // 黄色
plot(ta.ema(close, 24), title="24", color=color.rgb(208, 35, 208), linewidth=1) // 粉色
plot(ta.ema(close, 36), title="38", color=color.rgb(129, 169, 238), linewidth=1) // 墨绿
plot(ta.ema(close, 52), title="52", color=color.rgb(39, 208, 226), linewidth=1) // 蓝绿色
plot(ta.ema(close, 104), title="104", color=color.rgb(222, 109, 57), linewidth=1) // 棕色
// Vegas Channel (added EMAs)
ema144 = ta.ema(close, 144)
ema169 = ta.ema(close, 169)
plot(ema144, title="EMA 144", color=color.new(#e3ebf7, 0), linewidth=1)
plot(ema169, title="EMA 169", color=color.new(#e7e7f5, 0), linewidth=1)
// Fill between EMA 144 and EMA 169 with light blue background
fill(plot1 = plot(ema144, display=display.none),
plot2 = plot(ema169, display=display.none),
color = color.new(#deeff4, 70), title = "144-169 Area")
// Colored candles based on volume and price movement
isUp = close > open
isDown = close < open
highVolume = volume > ta.sma(volume, 50) * 3 // 50-period average + 50% threshold
// Define colors
bullishColor = color.new(#a5f1a5, 0) // Light green
bearishColor = color.new(#f2b661, 0) // Orange
// Plot candles
barcolor(isUp and highVolume ? bullishColor : isDown and highVolume ? bearishColor : na)
// © chenfwng88888
//version=6
indicator("辰锋", shorttitle="辰锋", overlay=true)
// 关键EMA均线组
plot(ta.ema(close, 12), title="13", color=color.rgb(230, 202, 58), linewidth=1) // 黄色
plot(ta.ema(close, 24), title="24", color=color.rgb(208, 35, 208), linewidth=1) // 粉色
plot(ta.ema(close, 36), title="38", color=color.rgb(129, 169, 238), linewidth=1) // 墨绿
plot(ta.ema(close, 52), title="52", color=color.rgb(39, 208, 226), linewidth=1) // 蓝绿色
plot(ta.ema(close, 104), title="104", color=color.rgb(222, 109, 57), linewidth=1) // 棕色
// Vegas Channel (added EMAs)
ema144 = ta.ema(close, 144)
ema169 = ta.ema(close, 169)
plot(ema144, title="EMA 144", color=color.new(#e3ebf7, 0), linewidth=1)
plot(ema169, title="EMA 169", color=color.new(#e7e7f5, 0), linewidth=1)
// Fill between EMA 144 and EMA 169 with light blue background
fill(plot1 = plot(ema144, display=display.none),
plot2 = plot(ema169, display=display.none),
color = color.new(#deeff4, 70), title = "144-169 Area")
// Colored candles based on volume and price movement
isUp = close > open
isDown = close < open
highVolume = volume > ta.sma(volume, 50) * 3 // 50-period average + 50% threshold
// Define colors
bullishColor = color.new(#a5f1a5, 0) // Light green
bearishColor = color.new(#f2b661, 0) // Orange
// Plot candles
barcolor(isUp and highVolume ? bullishColor : isDown and highVolume ? bearishColor : na)
Skrip open-source
Dengan semangat TradingView yang sesungguhnya, pembuat skrip ini telah menjadikannya sebagai sumber terbuka, sehingga para trader dapat meninjau dan memverifikasi fungsinya. Salut untuk penulisnya! Meskipun Anda dapat menggunakannya secara gratis, perlu diingat bahwa penerbitan ulang kode ini tunduk pada Tata Tertib kami.
Pernyataan Penyangkalan
Informasi dan publikasi ini tidak dimaksudkan, dan bukan merupakan, saran atau rekomendasi keuangan, investasi, trading, atau jenis lainnya yang diberikan atau didukung oleh TradingView. Baca selengkapnya di Ketentuan Penggunaan.