PROTECTED SOURCE SCRIPT
CRT + Daily Bias - Milana Trades
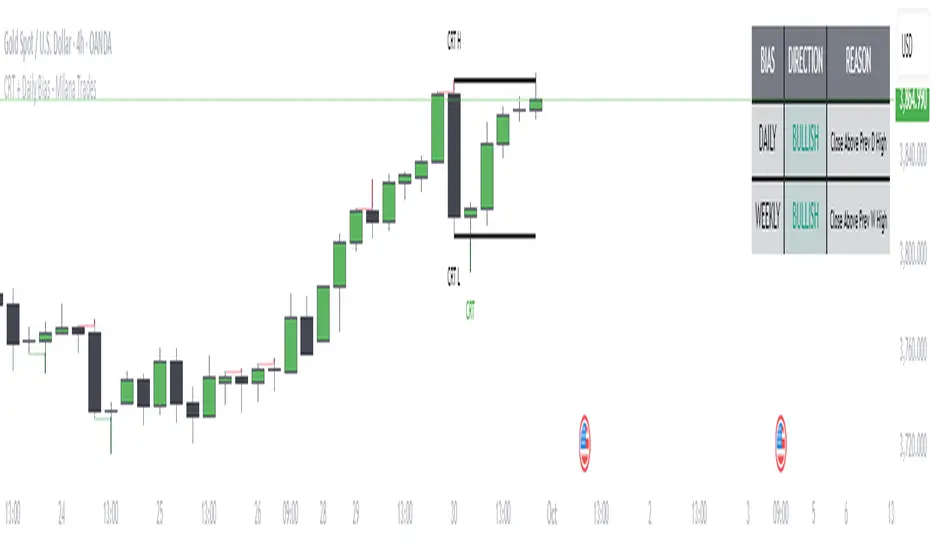
This indicator merges Candle Range Theory (CRT) with a Daily & Weekly Bias model, offering traders a complete view of both short-term price traps and higher-timeframe market direction. It is designed to highlight potential liquidity traps, reversals, and directional bias in a structured and visually intuitive format.
🔹 1. Candle Range Theory (CRT)
The CRT module detects false breakout candles (trap candles) and plots key high/low levels to mark significant turning points.
Bullish CRT
Occurs when price makes a lower low than the previous candle but closes bullish (close > open).
→ Suggests a possible upside reversal.
Bearish CRT
Occurs when price makes a higher high than the previous candle but closes bearish (close < open).
→ Suggests a possible downside reversal.
When a CRT is detected:
Dotted lines and levels are drawn from the trap candle’s high/low.
Labels such as CRT, CRT H, and CRT L appear for easy visualization.
Previous CRT structures can auto-clear when new traps form.
Alerts trigger once a trap is confirmed on candle close.
🔹 2. Daily & Weekly Bias
The Bias module determines market direction using daily and weekly candle structure. It evaluates:
Breaks above/below previous highs and lows.
Failed breaks (false moves beyond prior levels).
Inside bars (neutral range conditions).
Bias Logic Summary:
Close Above Previous High → Bullish
Close Below Previous Low → Bearish
Failed Break Above → Bearish
Failed Break Below → Bullish
Inside Range → Neutral
Both Daily and Weekly bias values are displayed in an on-chart table for quick context.
⚠️ Note:
The bias readings are technical references, not trading signals. Always combine them with your own analysis, context, and market awareness.
🔹 3. Bias Table
A clean table (top-right by default) displays:
Timeframe (Daily / Weekly)
Current Bias (Bullish, Bearish, Neutral)
Reason for bias (breakout, failure, or inside bar)
The table is fully customizable, allowing you to adjust:
Header and text colors
Background and border styles
Display of specific timeframes (Daily / Weekly)
🔹 4. Alerts
Real-time alerts notify you when:
Bullish CRT is detected
Bearish CRT is detected
Alerts only trigger on candle close for accuracy and reduced false signals.
🔹 5. Settings
CRT Module
Length: Number of bars CRT levels extend.
Clear Broken: Automatically removes old CRT levels when new traps form.
Trap Candle Colors: Customize bullish/bearish candle highlights.
Line & Label Style: Full control of label size, color, and line styling.
Bias Module
Show Table: Toggle on/off.
Show Daily / Weekly Bias: Select which to display.
Color Customization: Set colors for bias states and table design.
🔹 6. How to Use
Watch for CRT labels forming near major or liquidity areas.
Check the Daily/Weekly Bias Table for trend confirmation.
Align CRT signals with the bias direction for higher-probability setups.
Use alerts to stay informed without constantly monitoring charts.
Skrip terproteksi
Skrip ini diterbitkan sebagai sumber tertutup. Namun, anda dapat menggunakannya secara bebas dan tanpa batasan apa pun – pelajari lebih lanjut di sini.
Pernyataan Penyangkalan
Informasi dan publikasi tidak dimaksudkan untuk menjadi, dan bukan merupakan saran keuangan, investasi, perdagangan, atau rekomendasi lainnya yang diberikan atau didukung oleh TradingView. Baca selengkapnya di Persyaratan Penggunaan.