Narratives [Pro+]
Narratives [Pro+] is a comprehensive trading indicator designed to help traders build a structured narrative around price action. Built on the concepts of Inner Circle Trader, GxT Profiling, and HTF Analysis, It integrates advanced Smart Money concepts such as Fair Value Gaps, SMT Divergence, Liquidity Sweeps, Precision Swing Points, and Session Levels — all within one cohesive and adaptive system. Explore the features below:
Fair Value Gaps (FVG)
- Automatically detects and displays bullish and bearish Fair Value Gaps with dynamic invalidation
- Customizable colors, box limits, and extension behavior until price closes through the gap
- Automatically removes invalidated gaps for a cleaner view
Smart Money Technique (SMT) Divergence
- Detects divergence between correlated assets at Previous Day High/Low levels
- Automatic preset detection for major markets including Indices, Forex, Metals, Energy, and Crypto
- Inversion SMT detection when correlated assets sweep levels while the primary asset does not
- Labels display which specific assets are in divergence
Candle Sweep Detection
- Identifies C2 sweep patterns where Candle 2 sweeps Candle 1’s high or low and closes back
- Detects C3 closure patterns
- Dynamic detection removes sweep lines if subsequent price action invalidates the pattern
- Configurable maximum sweeps and optional bias filtering
Precision Swing Point (PSP)
- Detects swing highs and lows that occur with correlated asset divergence
- Two display modes:
- PSP Only – shows confirmed swing points with divergence
- All Precision Candles – highlights every divergence candle
- Supports up to three correlated assets with both manual and automatic preset modes
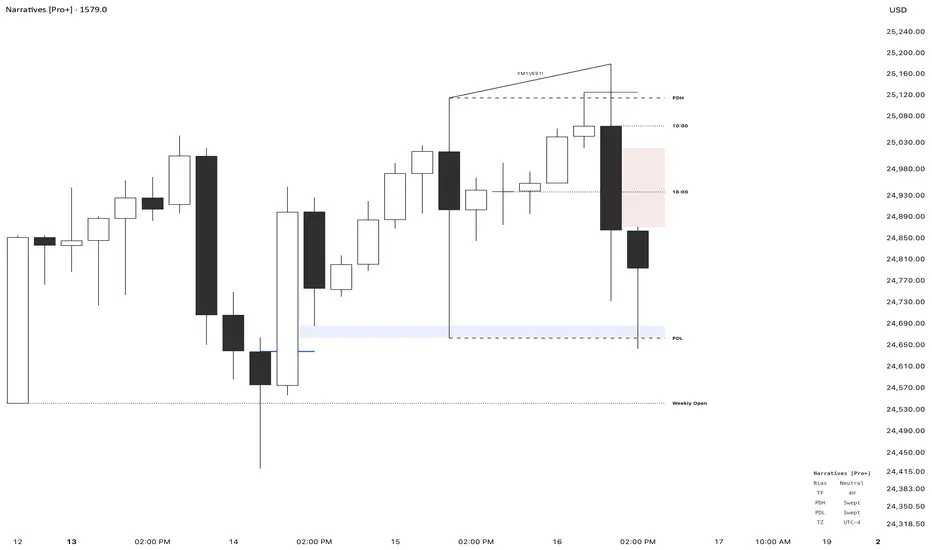
Previous Day High/Low (PDH/PDL)
- Plots previous day’s high and low across all intraday timeframes
- Dynamic mitigation stops line extension when levels are swept
- Customizable line styles for active and mitigated states
- Status tracking shows Intact or Swept in the information table
Previous Week High/Low (PWH/PWL)
- Plots previous week’s high and low with automatic detection across all intraday timeframes
- Dynamic mitigation stops line extension when levels are swept
- Customizable line styles for active and mitigated states
- Status tracking shows Intact or Swept in the information table
Premium / Discount Zones
- Automatically calculates and displays Premium and Discount ranges based on current structure
- Helps visualize optimal trade zones within equilibrium
- Optional midpoint (Equilibrium) line
- Fully customizable colors and fill styles
Killzone Levels
- Tracks Asia and London session highs and lows with automatic timezone conversion
- Levels extend until mitigated with optional line removal
- Session-based detection resets daily
Timeline Markers
- Four customizable vertical lines mark key trading times
- Default setup includes major market opens in New York timezone
- Optional display on lower timeframes
Quarterly Theory
- Plots vertical lines marking quarterly cycles across multiple timeframes
- 15M charts: 90m quarters
- 30M charts: Daily quarters (6-hour cycles from 6PM)
- 1H charts: Weekly quarters
- 4H charts: Monthly quarters
- Daily charts: Yearly quarters
Information Table
- Displays current bias, timeframe, PDH/PDL status, and timezone
- Customizable position, colors, font size, and individual element toggles
- Includes Ticker and Timeframe for quick reference
Skrip hanya-undangan
Hanya pengguna yang disetujui oleh penulis yang dapat mengakses skrip ini. Anda perlu meminta dan mendapatkan izin untuk menggunakannya. Izin ini biasanya diberikan setelah pembayaran. Untuk detail selengkapnya, ikuti petunjuk penulis di bawah ini atau hubungi chaesmt secara langsung.
TradingView TIDAK menyarankan untuk membayar atau menggunakan skrip kecuali Anda sepenuhnya mempercayai pembuatnya dan memahami cara kerjanya. Anda juga dapat menemukan alternatif yang gratis dan sumber terbuka di skrip komunitas kami.
Instruksi penulis
Pernyataan Penyangkalan
Skrip hanya-undangan
Hanya pengguna yang disetujui oleh penulis yang dapat mengakses skrip ini. Anda perlu meminta dan mendapatkan izin untuk menggunakannya. Izin ini biasanya diberikan setelah pembayaran. Untuk detail selengkapnya, ikuti petunjuk penulis di bawah ini atau hubungi chaesmt secara langsung.
TradingView TIDAK menyarankan untuk membayar atau menggunakan skrip kecuali Anda sepenuhnya mempercayai pembuatnya dan memahami cara kerjanya. Anda juga dapat menemukan alternatif yang gratis dan sumber terbuka di skrip komunitas kami.