OPEN-SOURCE SCRIPT
Dynamic Pivot Points
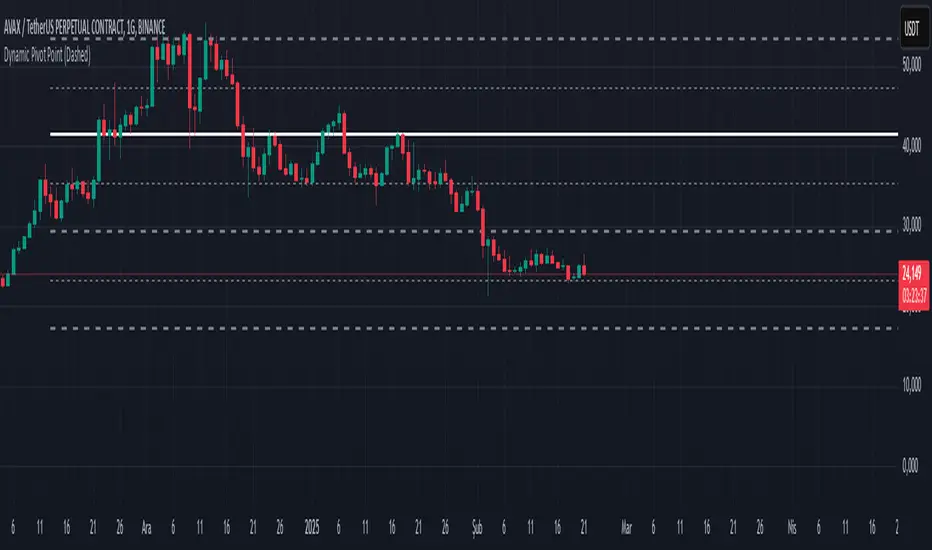
Dynamic Pivot Point Indicator
The Dynamic Pivot Point is an indicator used on the TradingView platform that dynamically calculates pivot points and displays them on the chart. This indicator provides automatically adjustable support and resistance levels for different timeframes. By visualizing dynamic levels that match current market conditions, traders can plan their strategies more effectively.
Features
Adapts to Timeframes
The indicator automatically selects the appropriate pivot calculation method based on the user's current timeframe. For example:
For short timeframes such as 1, 3, or 5 minutes, it uses daily (1D) data.
For medium timeframes like 15, 30, or 60 minutes, it uses weekly (1W) data.
For longer timeframes such as 120, 180, or 240 minutes, it uses monthly (1M) data.
For very long timeframes like 360, 480 minutes, daily (D), or weekly (1W), it uses 12-month (12M) data.
Dynamic Pivot Levels
The indicator automatically calculates pivot levels based on the specified high and low values.
Flexible Line Style Options
Users can choose different line styles (Dashed, Dotted, Solid) to improve visual clarity on the chart.
Clean and Clear Visualization
The indicator automatically removes previous lines and displays the latest levels clearly on the chart, preventing clutter and allowing traders to focus more efficiently.
How It Works
Identifying High and Low Levels
The indicator retrieves previous and current high and low levels based on the selected timeframe.
New high and low levels are updated by comparing them with previous levels.
Calculating Pivot Levels
Pivot points are calculated using Fibonacci ratios between high and low levels.
These levels represent dynamic support and resistance zones.
Drawing Lines
The calculated levels are displayed as lines on the chart, each represented with different colors and styles.
Use Cases
Support and Resistance Levels
The indicator dynamically calculates and displays support and resistance levels, serving as reference points for buy and sell decisions.
Trend Analysis
Fibonacci levels help identify trend strength and potential reversal points.
Risk Management
Pivot points assist in setting stop-loss and take-profit levels.
Multi-Timeframe Analysis
Since the indicator adapts to different timeframes, it can be used for both short-term and long-term analysis.
Advantages
✅ Automatic Calculation: No manual calculations are required, as it updates dynamically.
✅ Flexible Timeframe Support: Adapts to different timeframes.
✅ Visual Clarity: Line styles and colors make it easy to distinguish levels on the chart.
✅ Fibonacci Integration: Adds depth to technical analysis.
Conclusion
The Dynamic Pivot Point indicator is a useful tool for both beginners and experienced traders. By dynamically calculating pivot points and Fibonacci levels, it simplifies market analysis and aids in strategy development. With its flexible structure and clear visualization, it can be effectively used across all timeframes.
6 dakika önce
Sürüm Notları
This indicator is written for Support Resistance Traders
Skrip open-source
Dengan semangat TradingView yang sesungguhnya, pembuat skrip ini telah menjadikannya sebagai sumber terbuka, sehingga para trader dapat meninjau dan memverifikasi fungsinya. Salut untuk penulisnya! Meskipun Anda dapat menggunakannya secara gratis, perlu diingat bahwa penerbitan ulang kode ini tunduk pada Tata Tertib kami.
Pernyataan Penyangkalan
Informasi dan publikasi ini tidak dimaksudkan, dan bukan merupakan, saran atau rekomendasi keuangan, investasi, trading, atau jenis lainnya yang diberikan atau didukung oleh TradingView. Baca selengkapnya di Ketentuan Penggunaan.