OPEN-SOURCE SCRIPT
Previous Day Levels @darshakssc
This indicator provides intraday traders and analysts with immediate visual reference to the previous day's high, low, and close. These historical price levels are frequently watched by market participants for potential reaction, context, and session structure.
How to Add the Indicator:
What You Will See:
These are drawn automatically at each new session and remain visible throughout today’s trading.
Usage:
Use these levels as reference points for context, risk placement, or understanding shifts in session structure.
Watch for price interactions, rejections, or consolidations around these lines—they often act as support/resistance for many trading strategies.
No signals or trade advice are provided by this tool. All decisions are made manually by the trader.
Features:
Persistent, color-coded horizontal lines and clear, small labels.
No alerts, buy/sell arrows, or any indication of trading performance.
Fully automated for each new session—no action required from the user after adding.
Disclaimer:
This indicator is intended for informational and charting purposes only. It is not financial advice or a buy/sell recommendation. Always perform your own due diligence before making trading decisions.
How to Add the Indicator:
- Open any chart on TradingView.
- Click the Indicators button at the top.
- Search for “Previous Day Levels darshakssc” in the Public Library.
- Click the ★ Favorite icon if you wish to save it for quick access in the future.
- Click the indicator’s name to add it to your chart.
- The lines and labels will appear automatically on any intraday timeframe.
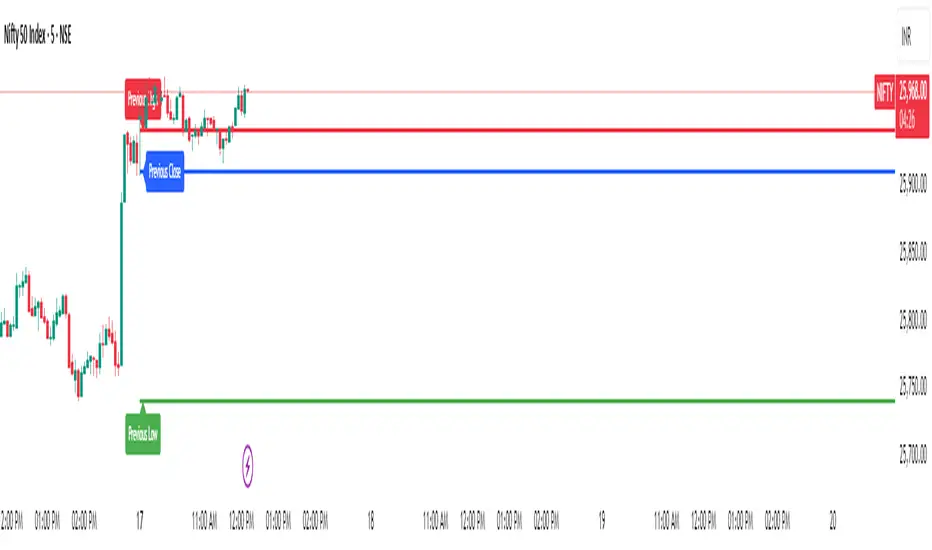
What You Will See:
- Previous day’s High (red line and label: “Previous High”).
- Previous day’s Low (green line and label: “Previous Low”).
- Previous day’s Close (blue line and label: “Previous Close”).
These are drawn automatically at each new session and remain visible throughout today’s trading.
Usage:
Use these levels as reference points for context, risk placement, or understanding shifts in session structure.
Watch for price interactions, rejections, or consolidations around these lines—they often act as support/resistance for many trading strategies.
No signals or trade advice are provided by this tool. All decisions are made manually by the trader.
Features:
Persistent, color-coded horizontal lines and clear, small labels.
No alerts, buy/sell arrows, or any indication of trading performance.
Fully automated for each new session—no action required from the user after adding.
Disclaimer:
This indicator is intended for informational and charting purposes only. It is not financial advice or a buy/sell recommendation. Always perform your own due diligence before making trading decisions.
Skrip open-source
Dengan semangat TradingView yang sesungguhnya, pembuat skrip ini telah menjadikannya sebagai sumber terbuka, sehingga para trader dapat meninjau dan memverifikasi fungsinya. Salut untuk penulisnya! Meskipun Anda dapat menggunakannya secara gratis, perlu diingat bahwa penerbitan ulang kode ini tunduk pada Tata Tertib kami.
Pernyataan Penyangkalan
Informasi dan publikasi ini tidak dimaksudkan, dan bukan merupakan, saran atau rekomendasi keuangan, investasi, trading, atau jenis lainnya yang diberikan atau didukung oleh TradingView. Baca selengkapnya di Ketentuan Penggunaan.