RicardoSantos

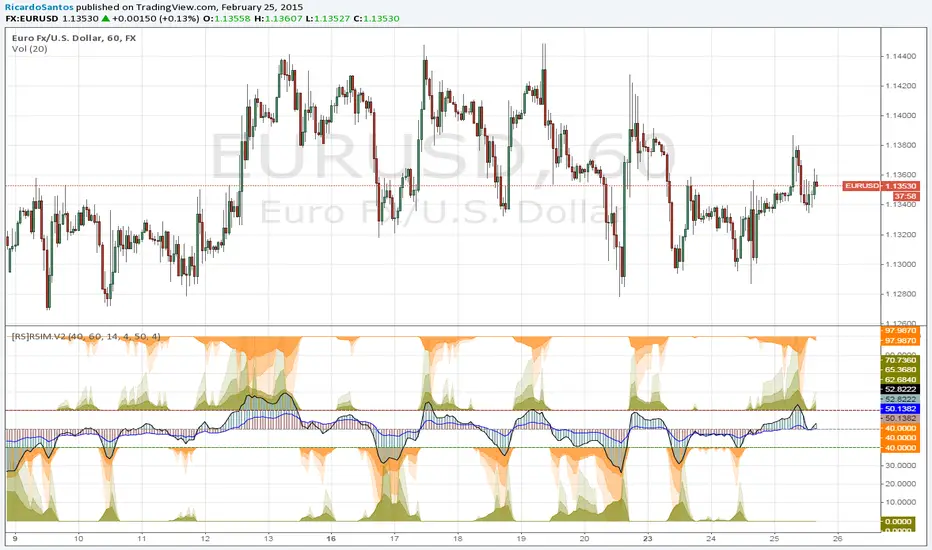
[RS]RSI Mirrors V2

EXPERIMENTAL: Updated version with smoothing options for the rsi's.
Skrip open-source

Dalam semangat TradingView, penulis dari skrip ini telah mempublikasikannya ke sumber-terbuka, maka trader dapat mengerti dan memverifikasinya. Semangat untuk penulis! Anda dapat menggunakannya secara gratis, namun penggunaan kembali kode ini dalam publikasi diatur oleh Tata Tertib. Anda dapat memfavoritkannya untuk digunakan pada chart

Pernyataan Penyangkalan

Informasi dan publikasi tidak dimaksudkan untuk menjadi, dan bukan merupakan saran keuangan, investasi, perdagangan, atau rekomendasi lainnya yang diberikan atau didukung oleh TradingView. Baca selengkapnya di Persyaratan Penggunaan.

Inggin menggunakan skrip ini pada chart?
study(title="[RS]RSI Mirrors V2", shorttitle="[RS]RSIM.V2", overlay=false)

buylimit = input(40)
selllimit = input(60)

source = close

rsi1 = sma(rsi(source, input(14, title="Fast RSI Length")), input(4, title="Fast RSI MA Smooth"))
rsi2 = sma(rsi(source, input(50, title="Slow RSI Length")), input(4, title="Slow RSI MA Smooth"))
//  ||---
excess = rsi2-rsi1
posexcess = excess > 0 ? buylimit-excess : buylimit
negexcess = excess < 0 ? selllimit-excess : selllimit

posexcess1 = excess > 0 ? rising(excess, 1) ? buylimit-excess*2 : buylimit-excess*0.75 : buylimit
negexcess1 = excess < 0 ? falling(excess, 1) ? selllimit-excess*2 : selllimit-excess*0.75 : selllimit
posexcess2 = excess > 0 ? rising(excess, 1) ? buylimit-excess*4 : buylimit-excess*0.75 : buylimit
negexcess2 = excess < 0 ? falling(excess, 1) ? selllimit-excess*4 : selllimit-excess*0.75 : selllimit

posfilter = posexcess < 0 ? 0 : posexcess
posfilter1 = posexcess1 < 0 ? 0 : posexcess1
posfilter2 = posexcess2 < 0 ? 0 : posexcess2
negfilter = negexcess > 100 ? 100 : negexcess
negfilter1 = negexcess1 > 100 ? 100 : negexcess1
negfilter2 = negexcess2 > 100 ? 100 : negexcess2

plot(posfilter, style=area, color=orange, transp=55, histbase=buylimit)
plot(negfilter, style=area, color=olive, transp=55, histbase=selllimit)
plot(posfilter1, style=area, color=orange, transp=70, histbase=buylimit)
plot(negfilter1, style=area, color=olive, transp=70, histbase=selllimit)
plot(posfilter2, style=area, color=orange, transp=85, histbase=buylimit)
plot(negfilter2, style=area, color=olive, transp=85, histbase=selllimit)
//  ||---   Mirroring
posmirror = excess > 0 ? rising(excess, 1) ? 0+excess*0.75 : 0+excess*1 : 0
posmirror1 = excess > 0 ? rising(excess, 1) ? 0+excess*0.75 : 0+excess*2 : 0
posmirror2 = excess > 0 ? rising(excess, 1) ? 0+excess*0.75 : 0+excess*4 : 0
negmirror = excess < 0 ? falling(excess, 1) ? 100+excess*0.75 : 100+excess : 100
negmirror1 = excess < 0 ? falling(excess, 1) ? 100+excess*0.75 : 100+excess*2 : 100
negmirror2 = excess < 0 ? falling(excess, 1) ? 100+excess*0.75 : 100+excess*4 : 100

posmfilter = posmirror > buylimit ? buylimit : posmirror
posmfilter1 = posmirror1 > buylimit ? buylimit : posmirror1
posmfilter2 = posmirror2 > buylimit ? buylimit : posmirror2
negmfilter = negmirror < selllimit ? selllimit : negmirror
negmfilter1 = negmirror1 < selllimit ? selllimit : negmirror1
negmfilter2 = negmirror2 < selllimit ? selllimit : negmirror2

plot(posmfilter, style=area, color=olive, transp=55, histbase=0)
plot(negmfilter, style=area, color=orange, transp=55, histbase=100)
plot(posmfilter1, style=area, color=olive, transp=70, histbase=0)
plot(negmfilter1, style=area, color=orange, transp=70, histbase=100)
plot(posmfilter2, style=area, color=olive, transp=85, histbase=0)
plot(negmfilter2, style=area, color=orange, transp=85, histbase=100)

//  ||---   Outputs
//  ||---   This need to be last to show on top.
plot(rsi1, color=#98b8be, style=histogram, linewidth=2, histbase=50)
plot(rsi2, color=#be9e98, style=histogram, linewidth=2, histbase=50)

plot(rsi1, color=black, style=line, linewidth=1)
plot(rsi2, color=blue, style=line, linewidth=1)

hline(buylimit, color=green)
hline(selllimit, color=maroon)
hline(50)