OPEN-SOURCE SCRIPT
[Global Contraction Expansion Index SGM]
Script Features
Dynamic Period Choice: The user can adjust the calculation period (period) for relative performance, allowing flexibility according to specific market analysis needs.
Sector Selection: The script takes into account different economic sectors through well-known ETFs like QQQ (technology), XLF (financial), XLY (consumer discretionary), XLV (healthcare), XLI (industrial) and XLE (energy). This diversification helps gain a general overview of economic health across different market segments.
Relative Performance Calculation: For each sector, the script calculates the relative performance using a simple moving average (SMA) of the price change over the specified period. This helps identify price trends adjusted for normal market fluctuations.
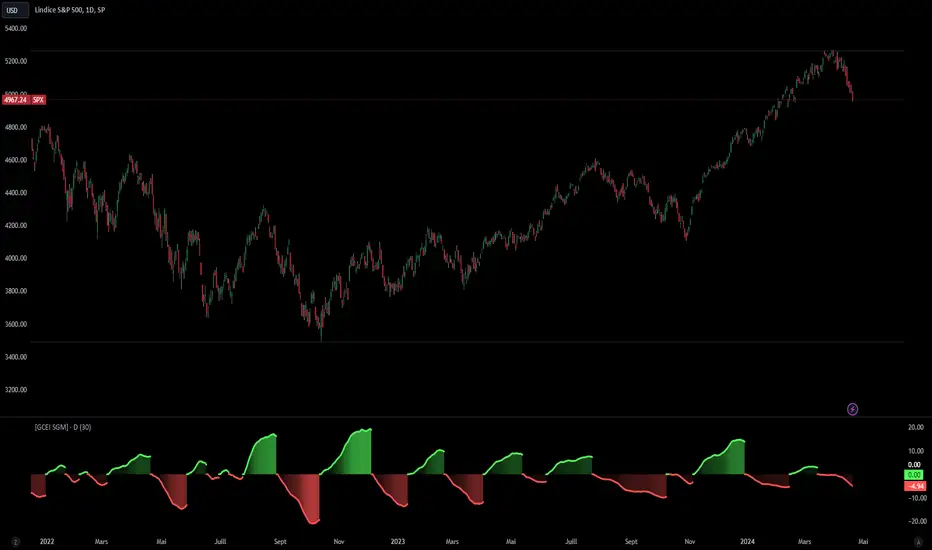
GCEI Index: The GCEI Index is calculated as the average of the relative performance of all sectors, multiplied by 100 to express it as a percentage. This provides an overall indicator of sectoral economic performance.
Crossover Signals: The script detects and marks points where the overall index (GCEI) crosses its own exponential moving average (emaGCEI), indicating potential changes in the overall trend of market performance.
Visualization: Results are visualized through graphs, where positive and negative regions are colored differently. Fills between the zero line and the index curves make it easy to see periods of contraction or expansion
When this index diverges from the SP500, it may be a sign that the technology sector is outperforming other sectors.

Dynamic Period Choice: The user can adjust the calculation period (period) for relative performance, allowing flexibility according to specific market analysis needs.
Sector Selection: The script takes into account different economic sectors through well-known ETFs like QQQ (technology), XLF (financial), XLY (consumer discretionary), XLV (healthcare), XLI (industrial) and XLE (energy). This diversification helps gain a general overview of economic health across different market segments.
Relative Performance Calculation: For each sector, the script calculates the relative performance using a simple moving average (SMA) of the price change over the specified period. This helps identify price trends adjusted for normal market fluctuations.
GCEI Index: The GCEI Index is calculated as the average of the relative performance of all sectors, multiplied by 100 to express it as a percentage. This provides an overall indicator of sectoral economic performance.
Crossover Signals: The script detects and marks points where the overall index (GCEI) crosses its own exponential moving average (emaGCEI), indicating potential changes in the overall trend of market performance.
Visualization: Results are visualized through graphs, where positive and negative regions are colored differently. Fills between the zero line and the index curves make it easy to see periods of contraction or expansion
When this index diverges from the SP500, it may be a sign that the technology sector is outperforming other sectors.
Skrip open-source
Dengan semangat TradingView yang sesungguhnya, pembuat skrip ini telah menjadikannya sebagai sumber terbuka, sehingga para trader dapat meninjau dan memverifikasi fungsinya. Salut untuk penulisnya! Meskipun Anda dapat menggunakannya secara gratis, perlu diingat bahwa penerbitan ulang kode ini tunduk pada Tata Tertib kami.
Sigaud | Junior Quantitative Trader & Developer
Combining technical expertise with analytical precision.
Gaining experience and growing in the field.
📧 Contact: from the website
Combining technical expertise with analytical precision.
Gaining experience and growing in the field.
📧 Contact: from the website
Pernyataan Penyangkalan
Informasi dan publikasi ini tidak dimaksudkan, dan bukan merupakan, saran atau rekomendasi keuangan, investasi, trading, atau jenis lainnya yang diberikan atau didukung oleh TradingView. Baca selengkapnya di Ketentuan Penggunaan.