OPEN-SOURCE SCRIPT
Diupdate Super Cycle Low Finder
How the Indicator Works
1. Inputs
Users can adjust the cycle lengths:
Daily Cycle: Default is 40 days (within 36-44 days).
Weekly Cycle: Default is 26 weeks (182 days, within 22-31 weeks).
Yearly Cycle: Default is 4 years (1460 days).
2. Cycle Low Detection
Function: detect_cycle_low finds the lowest low over the specified period and confirms it with a bullish candle (close > open).
Timeframes: Daily lows are calculated directly; weekly and yearly lows use request.security to fetch data from higher timeframes.
3. Half Cycle Lows
Detected over half the cycle length, plotted to show mid-cycle strength or weakness.
4. Cycle Translation
Logic: Compares the position of the highest high to the cycle’s midpoint.
Output: "R" for right translated (bullish), "L" for left translated (bearish), displayed above bars.
5. Cycle Failure
Flags when a new low falls below the previous cycle low, indicating a breakdown.
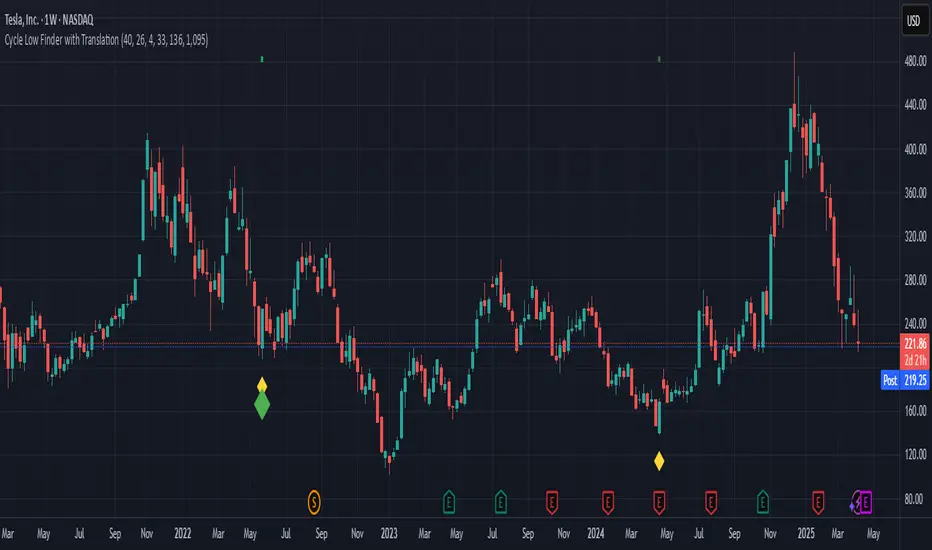
6. Visualization
Cycle Lows: Diamonds below bars (yellow for daily, green for weekly, blue for yearly).
Half Cycle Lows: Circles below bars (orange, lime, aqua).
Translations: "R" or "L" above bars in distinct colors.
Failures: Downward triangles below bars (red, orange, purple).
1. Inputs
Users can adjust the cycle lengths:
Daily Cycle: Default is 40 days (within 36-44 days).
Weekly Cycle: Default is 26 weeks (182 days, within 22-31 weeks).
Yearly Cycle: Default is 4 years (1460 days).
2. Cycle Low Detection
Function: detect_cycle_low finds the lowest low over the specified period and confirms it with a bullish candle (close > open).
Timeframes: Daily lows are calculated directly; weekly and yearly lows use request.security to fetch data from higher timeframes.
3. Half Cycle Lows
Detected over half the cycle length, plotted to show mid-cycle strength or weakness.
4. Cycle Translation
Logic: Compares the position of the highest high to the cycle’s midpoint.
Output: "R" for right translated (bullish), "L" for left translated (bearish), displayed above bars.
5. Cycle Failure
Flags when a new low falls below the previous cycle low, indicating a breakdown.
6. Visualization
Cycle Lows: Diamonds below bars (yellow for daily, green for weekly, blue for yearly).
Half Cycle Lows: Circles below bars (orange, lime, aqua).
Translations: "R" or "L" above bars in distinct colors.
Failures: Downward triangles below bars (red, orange, purple).
Catatan Rilis
How the Indicator Works1. Inputs
Users can adjust the cycle lengths:
Daily Cycle: Default is 40 days (within 36-44 days).
Weekly Cycle: Default is 26 weeks (182 days, within 22-31 weeks).
Yearly Cycle: Default is 4 years (1460 days).
2. Cycle Low Detection
Function: detect_cycle_low finds the lowest low over the specified period and confirms it with a bullish candle (close > open).
Timeframes: Daily lows are calculated directly; weekly and yearly lows use request.security to fetch data from higher timeframes.
3. Half Cycle Lows
Detected over half the cycle length, plotted to show mid-cycle strength or weakness.
4. Cycle Translation
Logic: Compares the position of the highest high to the cycle’s midpoint.
Output: "R" for right translated (bullish), "L" for left translated (bearish), displayed above bars.
5. Cycle Failure
Flags when a new low falls below the previous cycle low, indicating a breakdown.
6. Visualization
Cycle Lows: Diamonds below bars (yellow for daily, green for weekly, blue for yearly).
Half Cycle Lows: Circles below bars (orange, lime, aqua).
Translations: "R" or "L" above bars in distinct colors.
Failures: Downward triangles below bars (red, orange, purple).
Catatan Rilis
How Cycle Translation Works in the IndicatorKey Logic
Cycle Midpoint: For each cycle (e.g., 40 days for daily), the midpoint is calculated as half the cycle length (e.g., 20 days).
Cycle High: The highest high between two consecutive cycle lows is identified.
Translation Determination:
Right Translated (RT): If the cycle high occurs after the midpoint (fewer bars since the high than the midpoint), it’s bullish.
Left Translated (LT): If the cycle high occurs before the midpoint (more bars since the high than the midpoint), it’s bearish.
Catatan Rilis
bugs fixedCatatan Rilis
fixedCatatan Rilis
updateSkrip open-source
Dengan semangat TradingView yang sesungguhnya, pembuat skrip ini telah menjadikannya sebagai sumber terbuka, sehingga para trader dapat meninjau dan memverifikasi fungsinya. Salut untuk penulisnya! Meskipun Anda dapat menggunakannya secara gratis, perlu diingat bahwa penerbitan ulang kode ini tunduk pada Tata Tertib kami.
Pernyataan Penyangkalan
Informasi dan publikasi ini tidak dimaksudkan, dan bukan merupakan, saran atau rekomendasi keuangan, investasi, trading, atau jenis lainnya yang diberikan atau didukung oleh TradingView. Baca selengkapnya di Ketentuan Penggunaan.
Skrip open-source
Dengan semangat TradingView yang sesungguhnya, pembuat skrip ini telah menjadikannya sebagai sumber terbuka, sehingga para trader dapat meninjau dan memverifikasi fungsinya. Salut untuk penulisnya! Meskipun Anda dapat menggunakannya secara gratis, perlu diingat bahwa penerbitan ulang kode ini tunduk pada Tata Tertib kami.
Pernyataan Penyangkalan
Informasi dan publikasi ini tidak dimaksudkan, dan bukan merupakan, saran atau rekomendasi keuangan, investasi, trading, atau jenis lainnya yang diberikan atau didukung oleh TradingView. Baca selengkapnya di Ketentuan Penggunaan.