PROTECTED SOURCE SCRIPT
[N]RSIOMA
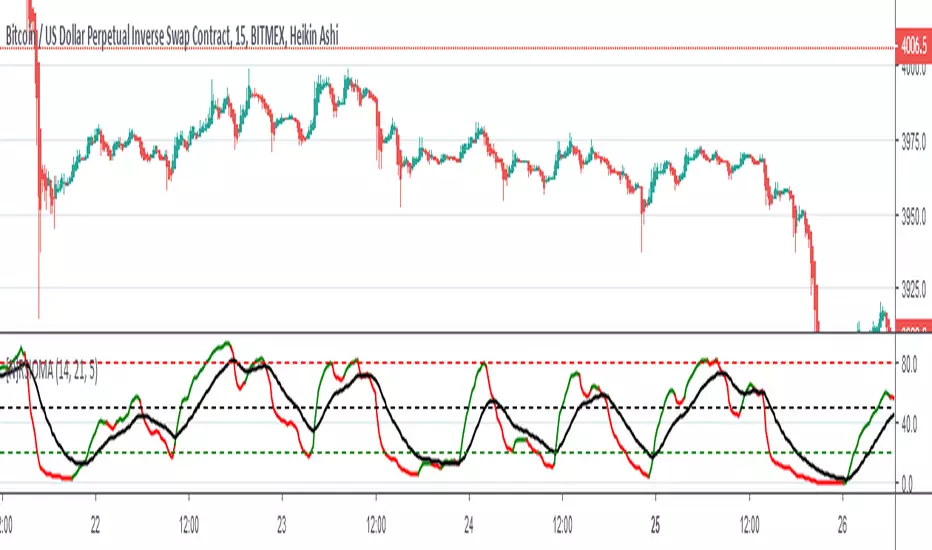
RSIOMA is the abbreviation for Relative Strength index (RSI) of moving averages (MA).
Rules:
RSI above MA and RSI above level 50 is a signal of a bullish trend. RSI below MA and RSI below level 50 is a signal of a bearish trend.
One can also buy when the RSI breaks level 20 from below and sell when RSI breaks level 80 from above
Tip 1: Look out for bounces. When RSI line bounces off from MA line it means the trend will likely continue;
Tip 2: Look out for support / resistance of RSI LINE.
Tip 3: USE as follow = higher timeframe to lower timeframe
Skrip terproteksi
Skrip ini diterbitkan sebagai sumber tertutup. Namun, Anda dapat menggunakannya dengan bebas dan tanpa batasan apa pun – pelajari lebih lanjut di sini.
Pernyataan Penyangkalan
Informasi dan publikasi ini tidak dimaksudkan, dan bukan merupakan, saran atau rekomendasi keuangan, investasi, trading, atau jenis lainnya yang diberikan atau didukung oleh TradingView. Baca selengkapnya di Ketentuan Penggunaan.