OPEN-SOURCE SCRIPT
Diupdate RSI Levels On Chart [MisterMoTA]
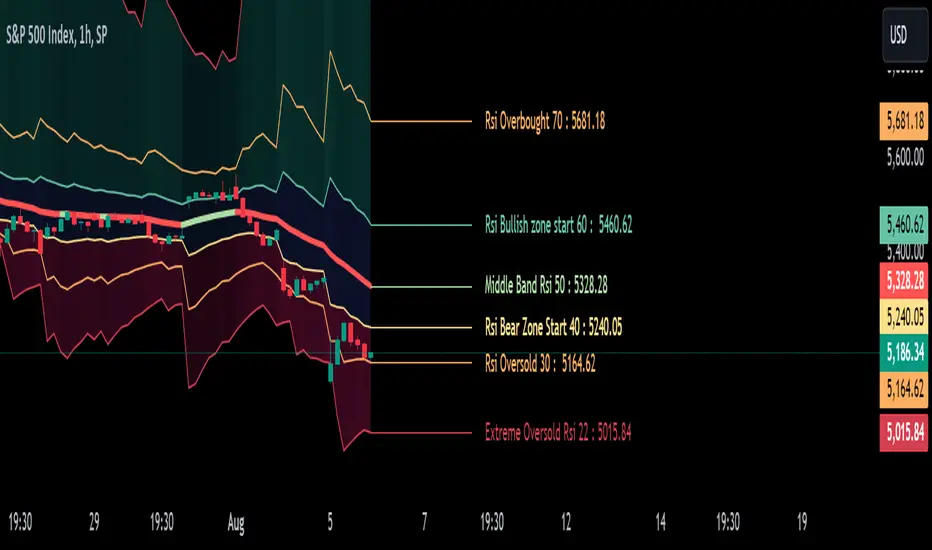
The values of the RSI Levels On Chart are calculated using Reverse Engineering RSI calculations by Giorgos Siligardos, Ph.D.
Instead of using only the 50 line of the RSI on chart I added options for users to define the Extreme Overbought and Oversold values, also simple Oversold and Overbought values, start of Bullish and Bearish zones and the 50 rsi value.
With the RSI Levels On Chart users are able to see on chart the price that a candles need to close for a certain value of the RSI. E.g. what price is needed for the RSI to be at oversold 30 or what would be the price when rsi will cross the 50 line.
The script has the 50 line color coded that will turn red when the line falling and will change to the user input color when it will be rising, helping users to see fast the clear trend of any asset on any timeframe from 1 second to 12 months.
I added few alerts for rsi overbought, oversold, extreme overbought and extreme oversold, crossing 50 level, crossing bullish or bearish zones values and also alerts for the 50 line falling or rising.
You can use RSI Levels On Chart as a simple indicator or you can add your favorite oscilator(s) to have a clear view of the trends of the markets, in this demo I added RSI + Divergences + Alerts [MisterMoTA] with a moving average set to 50 RMA.
Catatan Rilis
Updated the chart to not display the second indicator on publishing window of the script
Catatan Rilis
- removed decimals variable, so now the script wiill diplay the price with decimals auto by ticker decimals, no need to change on each asset the number of decimals anymore
Catatan Rilis
- I removed all the indicators inputs and values from the status line to improve chart visibility
- Upgraded the code to version 6 of pine script
Skrip open-source
Dengan semangat TradingView yang sesungguhnya, pembuat skrip ini telah menjadikannya sebagai sumber terbuka, sehingga para trader dapat meninjau dan memverifikasi fungsinya. Salut untuk penulisnya! Meskipun Anda dapat menggunakannya secara gratis, perlu diingat bahwa penerbitan ulang kode ini tunduk pada Tata Tertib kami.
Pernyataan Penyangkalan
Informasi dan publikasi ini tidak dimaksudkan, dan bukan merupakan, saran atau rekomendasi keuangan, investasi, trading, atau jenis lainnya yang diberikan atau didukung oleh TradingView. Baca selengkapnya di Ketentuan Penggunaan.