OPEN-SOURCE SCRIPT
CarrerasTrend
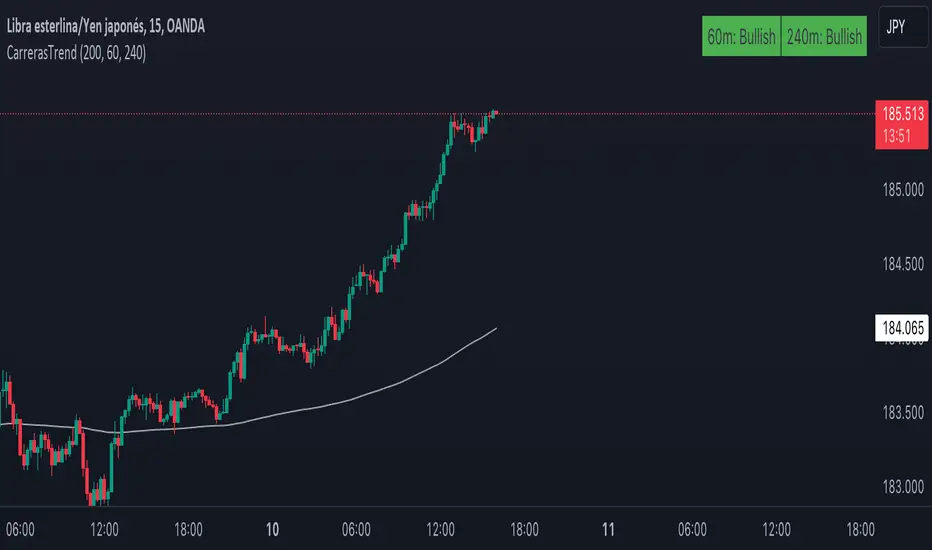
This indicator, created by Maximiliano Carreras, displays the trend based on the 200-period EMA (Adjustable) on the chart. The EMA is calculated based on data from the 1-hour and 4-hour charts (Both adjustable timeframes). The indicator labels the trend as "Bullish" if the closing price is above the EMA and as "Bearish" if it is below. The indicator is shown in the top right corner of the chart, providing information about the overall trend of the underlying asset.
You can also choose whether to display the EMA on the chart or not, as well as select between 1 or 2 timeframes for display.
Feel free to leave a comment if you liked it!
Ahora en Español:
Este indicador, creado por Maximiliano Carreras, muestra la tendencia basada en la EMA de 200 periodos (Modificable) en el gráfico. La EMA es calculada en función de los datos del gráfico de 1 y 4 horas (Modificables ambos tiempos). El indicador etiqueta la tendencia como "Bullish" (alcista) si el precio de cierre está por encima de la EMA y como "Bearish" (bajista) si está por debajo. El indicador se muestra en la esquina superior derecha del gráfico, proporcionando información sobre la tendencia general del activo subyacente.
También se puede mostrar o no la ema en el gráfico, al igual si elegir 1 o 2 tiempos para mostrar
Dejame un comentario si te gustó
Skrip open-source
Dengan semangat TradingView yang sesungguhnya, pembuat skrip ini telah menjadikannya sebagai sumber terbuka, sehingga para trader dapat meninjau dan memverifikasi fungsinya. Salut untuk penulisnya! Meskipun Anda dapat menggunakannya secara gratis, perlu diingat bahwa penerbitan ulang kode ini tunduk pada Tata Tertib kami.
Pernyataan Penyangkalan
Informasi dan publikasi ini tidak dimaksudkan, dan bukan merupakan, saran atau rekomendasi keuangan, investasi, trading, atau jenis lainnya yang diberikan atau didukung oleh TradingView. Baca selengkapnya di Ketentuan Penggunaan.