PROTECTED SOURCE SCRIPT
Kornél CCI Divergence — Price Overlay (All levels + EMA50) v6
English/Hungarian
🔎 Overview
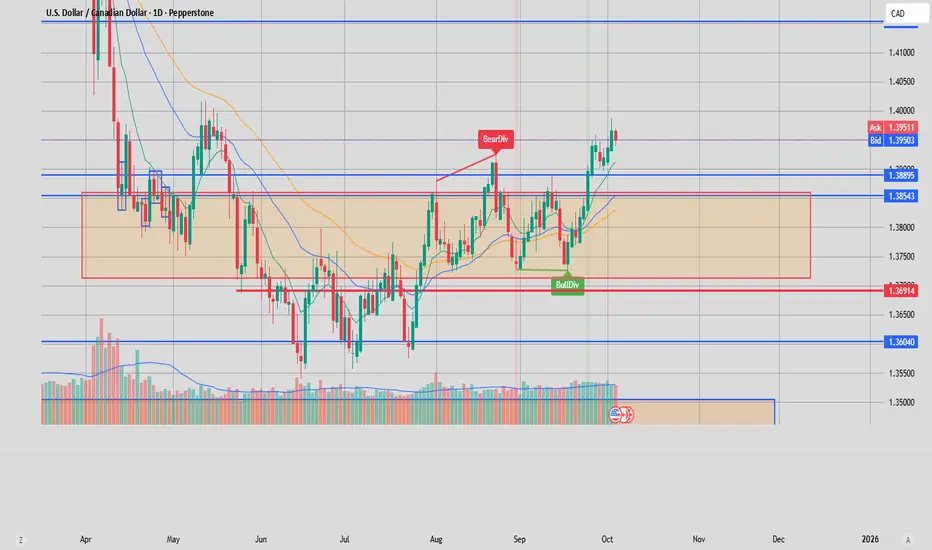
This is a CCI divergence indicator that looks for discrepancies (divergences) between the price and the CCI (Commodity Channel Index) and plots them on the chart with lines and labels.
⚙️ How it works
It searches for pivot points in the price:
Pivot High (local high)
Pivot Low (local low)
It uses the ta.pivothigh() and ta.pivotlow() functions for this.
For these pivots, it checks the CCI value on the same candle.
Then it compares two consecutive pivots:
Bullish divergence (green):
Price makes a lower low (LL)
CCI makes a higher low (HL)
Price is above the EMA50 (uptrend)
Bearish divergence (red):
Price makes a higher high (HH)
CCI makes a lower high (LH)
Price is below the EMA50 (downtrend)
If a divergence is detected:
Draws a line connecting the two pivots
Adds a label (“BullDiv” or “BearDiv”)
Sets an alert to notify the user
EMA50 trend filter:
Accepts bullish divergences only if price is above EMA50
Accepts bearish divergences only if price is below EMA50
This filters out “false” signals
Keeping the chart clean:
Stores a maximum of X lines and labels at a time (maxLines), deleting older ones
📈 Practical meaning
If the price makes a new low but the CCI does not → Bullish Divergence (price weakness, potential upward reversal)
If the price makes a new high but the CCI does not → Bearish Divergence (trend exhaustion, potential drop)
So it tries to provide reversal signals.
Thanks to the EMA50, it only highlights divergences that align with the current trend → a trend-following divergence filter.
👉 In short:
This indicator plots pivot-based divergences between CCI and price, and only signals when the divergence aligns with the trend indicated by the EMA50.
Magyar:
🔎 Áttekintés
Ez egy CCI divergencia indikátor, amely a CCI (Commodity Channel Index) és az ár közötti eltéréseket (divergenciákat) keresi, és vonalakkal és címkékkel ábrázolja a grafikonon.
⚙️ Hogyan működik
Keresi a pivot pontokat az árban:
Pivot High (helyi csúcs)
Pivot Low (helyi mélypont)
Ehhez a ta.pivothigh() és ta.pivotlow() függvényeket használja.
Ezeknél a pivot pontoknál megnézi a CCI értékét ugyanazon a gyertyán.
Ezután összehasonlít két egymást követő pivotot:
Bullish divergencia (zöld):
Az ár alacsonyabb mélypontot (LL) csinál
A CCI magasabb mélypontot (HL) csinál
Az ár az EMA50 fölött van (emelkedő trend)
Bearish divergencia (piros):
Az ár magasabb csúcsot (HH) csinál
A CCI alacsonyabb csúcsot (LH) csinál
Az ár az EMA50 alatt van (csökkenő trend)
Ha divergencia történik:
Vonalat húz a két pivot pont között
Címkét ad hozzá („BullDiv” vagy „BearDiv”)
Értesítést (alertet) állít be a felhasználónak
EMA50 trend szűrő:
Bullish divergenciát csak akkor fogad el, ha az ár EMA50 fölött van
Bearish divergenciát csak akkor fogad el, ha az ár EMA50 alatt van
Ez kiszűri a „hamis” jeleket
A grafikon tisztán tartása:
Egyszerre maximum X vonalat és címkét tárol (maxLines), a régebbieket törli
📈 Gyakorlati jelentés
Ha az ár új mélypontot ér el, de a CCI nem → Bullish Divergence (árgyengülés, potenciális emelkedés)
Ha az ár új csúcsot ér el, de a CCI nem → Bearish Divergence (trend kifulladása, potenciális csökkenés)
Tehát az indikátor fordulós jeleket próbál adni.
Az EMA50 segítségével csak az aktuális trenddel összhangban lévő divergenciákat emeli ki → trendkövető divergencia szűrő.
👉 Röviden:
Ez az indikátor a CCI és az ár pivot pontjai közötti divergenciákat ábrázolja, és csak akkor jelez, ha a divergencia összhangban van az EMA50 által jelzett trenddel.
🔎 Overview
This is a CCI divergence indicator that looks for discrepancies (divergences) between the price and the CCI (Commodity Channel Index) and plots them on the chart with lines and labels.
⚙️ How it works
It searches for pivot points in the price:
Pivot High (local high)
Pivot Low (local low)
It uses the ta.pivothigh() and ta.pivotlow() functions for this.
For these pivots, it checks the CCI value on the same candle.
Then it compares two consecutive pivots:
Bullish divergence (green):
Price makes a lower low (LL)
CCI makes a higher low (HL)
Price is above the EMA50 (uptrend)
Bearish divergence (red):
Price makes a higher high (HH)
CCI makes a lower high (LH)
Price is below the EMA50 (downtrend)
If a divergence is detected:
Draws a line connecting the two pivots
Adds a label (“BullDiv” or “BearDiv”)
Sets an alert to notify the user
EMA50 trend filter:
Accepts bullish divergences only if price is above EMA50
Accepts bearish divergences only if price is below EMA50
This filters out “false” signals
Keeping the chart clean:
Stores a maximum of X lines and labels at a time (maxLines), deleting older ones
📈 Practical meaning
If the price makes a new low but the CCI does not → Bullish Divergence (price weakness, potential upward reversal)
If the price makes a new high but the CCI does not → Bearish Divergence (trend exhaustion, potential drop)
So it tries to provide reversal signals.
Thanks to the EMA50, it only highlights divergences that align with the current trend → a trend-following divergence filter.
👉 In short:
This indicator plots pivot-based divergences between CCI and price, and only signals when the divergence aligns with the trend indicated by the EMA50.
Magyar:
🔎 Áttekintés
Ez egy CCI divergencia indikátor, amely a CCI (Commodity Channel Index) és az ár közötti eltéréseket (divergenciákat) keresi, és vonalakkal és címkékkel ábrázolja a grafikonon.
⚙️ Hogyan működik
Keresi a pivot pontokat az árban:
Pivot High (helyi csúcs)
Pivot Low (helyi mélypont)
Ehhez a ta.pivothigh() és ta.pivotlow() függvényeket használja.
Ezeknél a pivot pontoknál megnézi a CCI értékét ugyanazon a gyertyán.
Ezután összehasonlít két egymást követő pivotot:
Bullish divergencia (zöld):
Az ár alacsonyabb mélypontot (LL) csinál
A CCI magasabb mélypontot (HL) csinál
Az ár az EMA50 fölött van (emelkedő trend)
Bearish divergencia (piros):
Az ár magasabb csúcsot (HH) csinál
A CCI alacsonyabb csúcsot (LH) csinál
Az ár az EMA50 alatt van (csökkenő trend)
Ha divergencia történik:
Vonalat húz a két pivot pont között
Címkét ad hozzá („BullDiv” vagy „BearDiv”)
Értesítést (alertet) állít be a felhasználónak
EMA50 trend szűrő:
Bullish divergenciát csak akkor fogad el, ha az ár EMA50 fölött van
Bearish divergenciát csak akkor fogad el, ha az ár EMA50 alatt van
Ez kiszűri a „hamis” jeleket
A grafikon tisztán tartása:
Egyszerre maximum X vonalat és címkét tárol (maxLines), a régebbieket törli
📈 Gyakorlati jelentés
Ha az ár új mélypontot ér el, de a CCI nem → Bullish Divergence (árgyengülés, potenciális emelkedés)
Ha az ár új csúcsot ér el, de a CCI nem → Bearish Divergence (trend kifulladása, potenciális csökkenés)
Tehát az indikátor fordulós jeleket próbál adni.
Az EMA50 segítségével csak az aktuális trenddel összhangban lévő divergenciákat emeli ki → trendkövető divergencia szűrő.
👉 Röviden:
Ez az indikátor a CCI és az ár pivot pontjai közötti divergenciákat ábrázolja, és csak akkor jelez, ha a divergencia összhangban van az EMA50 által jelzett trenddel.
Skrip terproteksi
Skrip ini diterbitkan sebagai sumber tertutup. However, you can use it freely and without any limitations – learn more here.
Pernyataan Penyangkalan
The information and publications are not meant to be, and do not constitute, financial, investment, trading, or other types of advice or recommendations supplied or endorsed by TradingView. Read more in the Terms of Use.