OPEN-SOURCE SCRIPT
Dynamic Price Impulse
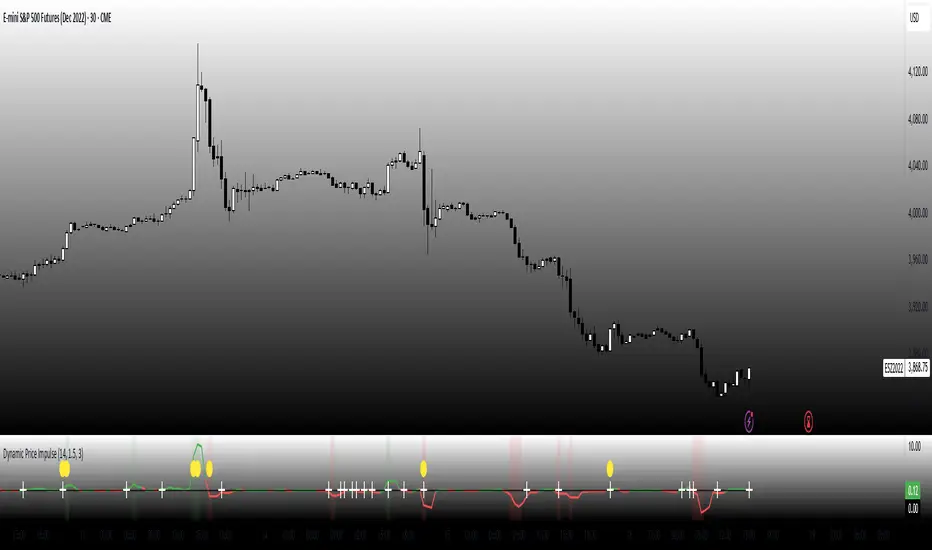
This indicator is designed to capture price momentum without the lag typically found in traditional oscillators.
Core Mechanics
Instead of using simple price differences, the indicator normalizes changes relative to the average true range (ATR), making it adaptive to different volatility regimes.
By squaring the normalized change while preserving its sign, the indicator responds more aggressively to stronger price moves while remaining sensitive to smaller ones.
The indicator identifies periods when volatility is expanding, which often precede significant price movements.
Trading Strategy Applications
1. Momentum Signals:
o When the indicator crosses above zero, look for long entries
o When it crosses below zero, look for short entries
o The stronger the impulse (farther from zero), the stronger the signal
2. Early Trend Detection:
o Volatility expansion markers (yellow circles) often appear at the beginning of new trends
o Use these as early warning signals to prepare for potential entries
3. Trend Continuation:
o Strong readings in the direction of the trend suggest continuation
o Weakening readings suggest the trend may be losing steam
4. Counter-Trend Opportunities:
o Look for divergences between price and the indicator for potential reversals
o When price makes a new high but the indicator doesn't, consider potential shorts (and vice versa)
Fine-Tuning
• Length (14): Controls the lookback period for ATR calculation. Lower values make it more responsive but noisier.
• Threshold (1.5): Determines how much volatility needs to expand to trigger the volatility expansion signal.
• Smoothing (3): Reduces noise in the signal. Higher values reduce false signals but introduce more lag.
Skrip open-source
Dengan semangat TradingView yang sesungguhnya, pembuat skrip ini telah menjadikannya sebagai sumber terbuka, sehingga para trader dapat meninjau dan memverifikasi fungsinya. Salut untuk penulisnya! Meskipun Anda dapat menggunakannya secara gratis, perlu diingat bahwa penerbitan ulang kode ini tunduk pada Tata Tertib kami.
Pernyataan Penyangkalan
Informasi dan publikasi ini tidak dimaksudkan, dan bukan merupakan, saran atau rekomendasi keuangan, investasi, trading, atau jenis lainnya yang diberikan atau didukung oleh TradingView. Baca selengkapnya di Ketentuan Penggunaan.