PROTECTED SOURCE SCRIPT
Diupdate RSI Buy-Sell Indicator - MissouriTim

The RSI Buy-Sell Indicator by MissouriTim, is an advanced trading tool designed to elevate your trading strategy. This indicator leverages the power of the Relative Strength Index (RSI) to provide clear and actionable buy and sell signals, ensuring you make informed trading decisions with confidence.
Key Features:
Customizable RSI Settings: Tailor the RSI source, length, and thresholds for overbought and oversold conditions to fit your trading style.
Real-Time Alerts: Enable BUY and SELL alerts to receive instant notifications when market conditions meet your criteria.
Visual Clarity: Easily distinguish between buy and sell signals with customizable line colors, ensuring you never miss a trading opportunity.
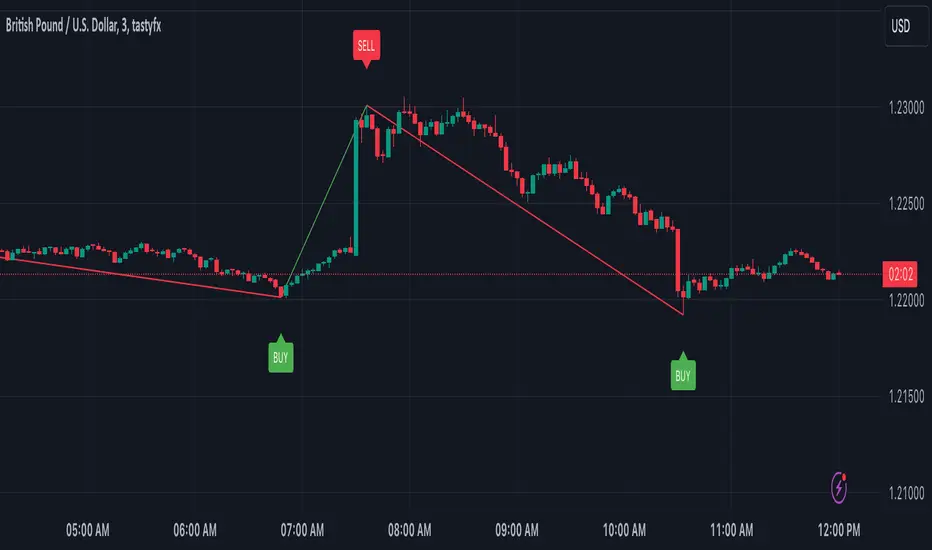
Intelligent Labeling: Buy and Sell labels dynamically update to reflect overbought and oversold current market conditions, providing you with clear entry and exit points.
Swing Lines: Visualize price movements with intuitive swing lines that connect recent highs and lows, helping you spot trends and reversals.
How It Works:
The RSI Buy-Sell Indicator utilizes the RSI and a specially designed algorithm to determine when an asset is overbought or oversold. When the RSI value crosses the specified overbought or oversold thresholds, the indicator generates a signal, displayed as a label on the chart. Additionally, swing lines are drawn to connect recent highs and lows, offering a visual representation of market trends.
This tool is perfect for traders who want to enhance their technical analysis and make more informed decisions. With its customizable settings and real-time alerts, the RSI Buy-Sell Indicator by MissouriTim is a must-have for any serious trader.
Catatan Rilis
The BUY and SELL labels were repainting. This update fixes this issue.Catatan Rilis
This indicator has been updated to provide extra layers of confirmation for both BUY and SELL signals. The code has also been updated to reduce potential repainting of the signals.Skrip terproteksi
Skrip ini diterbitkan sebagai sumber tertutup. Namun, Anda dapat menggunakannya dengan bebas dan tanpa batasan apa pun – pelajari lebih lanjut di sini.
Pernyataan Penyangkalan
Informasi dan publikasi ini tidak dimaksudkan, dan bukan merupakan, saran atau rekomendasi keuangan, investasi, trading, atau jenis lainnya yang diberikan atau didukung oleh TradingView. Baca selengkapnya di Ketentuan Penggunaan.
Skrip terproteksi
Skrip ini diterbitkan sebagai sumber tertutup. Namun, Anda dapat menggunakannya dengan bebas dan tanpa batasan apa pun – pelajari lebih lanjut di sini.
Pernyataan Penyangkalan
Informasi dan publikasi ini tidak dimaksudkan, dan bukan merupakan, saran atau rekomendasi keuangan, investasi, trading, atau jenis lainnya yang diberikan atau didukung oleh TradingView. Baca selengkapnya di Ketentuan Penggunaan.