OPEN-SOURCE SCRIPT
Stochastic Momentum Index _ UCSgears
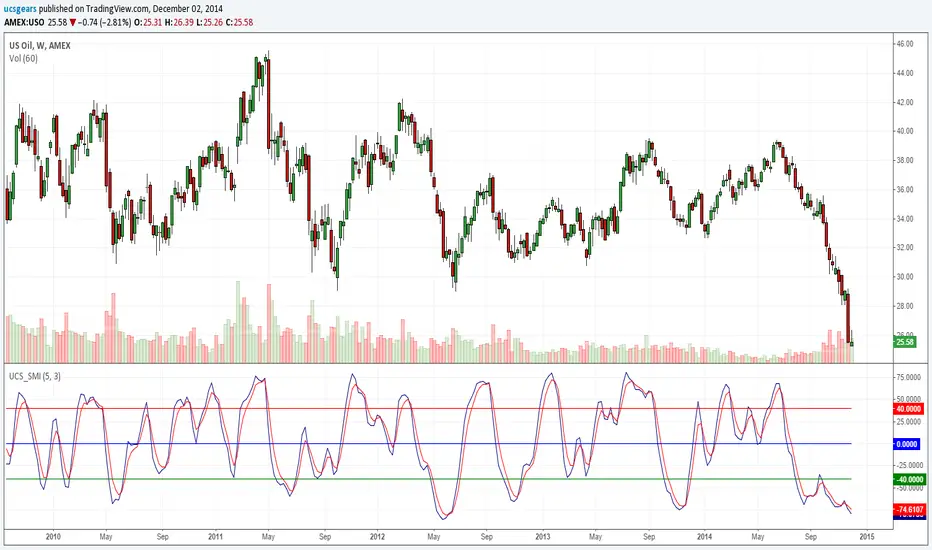
The Stochastic Momentum Index (SMI) was introduced by William Blau in 1993 as a way to clarify the traditional stochastic oscillator. SMI helps you see where the current close has taken place relative to the midpoint of the recent high to low range is based on price change in relation to the range of the price. This is a range based indicator, when used right. It can help momentum changes.
For those looking for help understanding this -
wiki.timetotrade.eu/Stochastic_Momentum_Index
tradingstrategyideas.com/entries/stochastic-momentum-index/
tlc.thinkorswim.com/center/charting/studies/studies-library/R-S/StochasticMomentumIndex.html
sierrachart.com/supportboard/attachment.php?attachmentid=4714&d=1277899234
Skrip open-source
Dengan semangat TradingView yang sesungguhnya, pembuat skrip ini telah menjadikannya sebagai sumber terbuka, sehingga para trader dapat meninjau dan memverifikasi fungsinya. Salut untuk penulisnya! Meskipun Anda dapat menggunakannya secara gratis, perlu diingat bahwa penerbitan ulang kode ini tunduk pada Tata Tertib kami.
Uday C Santhakumar
udaycs.substack.com/
udaycs.substack.com/
Pernyataan Penyangkalan
Informasi dan publikasi ini tidak dimaksudkan, dan bukan merupakan, saran atau rekomendasi keuangan, investasi, trading, atau jenis lainnya yang diberikan atau didukung oleh TradingView. Baca selengkapnya di Ketentuan Penggunaan.