OPEN-SOURCE SCRIPT
Diupdate Crypto/Stable Mcap Ratio Normalized
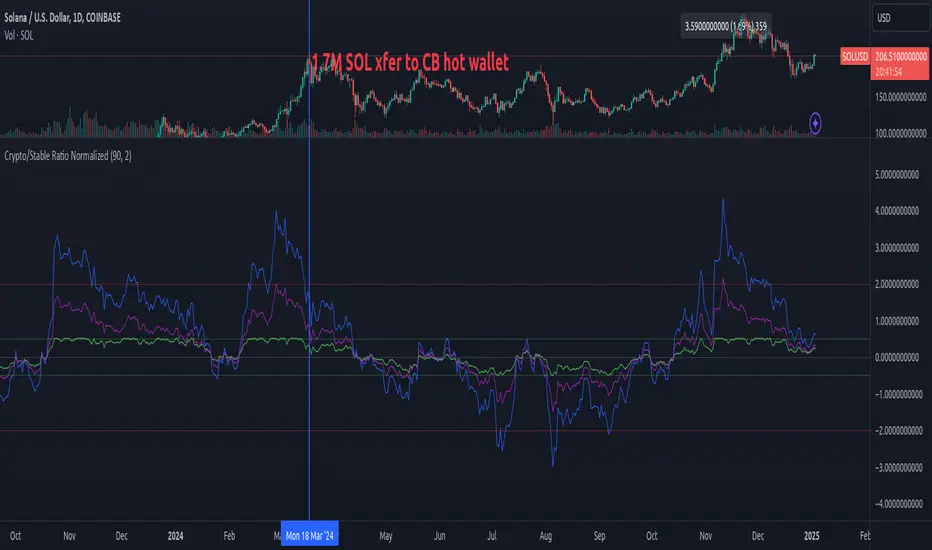
Create a normalized ratio of total crypto market cap to stablecoin supply (USDT + USDC + DAI). Idea is to create a reference point for the total market cap's position, relative to total "dollars" in the crypto ecosystem. It's an imperfect metric, but potentially helpful. V0.1.
This script provides four different normalization methods:
Z-Score Normalization:
Min-Max Normalization:
Percent of All-Time Range:
Bollinger Band Position:
Features:
This script provides four different normalization methods:
Z-Score Normalization:
- Shows how many standard deviations the ratio is from its mean
- Good for identifying extreme values
- Mean-reverting properties
Min-Max Normalization:
- Scales values between 0 and 1
- Good for relative position within recent range
- More sensitive to recent changes
Percent of All-Time Range:
- Shows where current ratio is relative to all-time highs/lows
- Good for historical context
- Less sensitive to recent changes
Bollinger Band Position:
- Similar to z-score but with adjustable sensitivity
- Good for trading signals
- Can be tuned via standard deviation multiplier
Features:
- Adjustable lookback period
- Reference bands for overbought/oversold levels
- Built-in alerts for extreme values
- Color-coded plots for easy visualization
Catatan Rilis
Create a normalized ratio of total crypto market cap to stablecoin supply (USDT + USDC + DAI). Idea is to create a reference point for the total market cap's position, relative to total "dollars" in the crypto ecosystem. It's an imperfect metric, but potentially helpful. V0.1.This script provides four different normalization methods:
Z-Score Normalization:
- Shows how many standard deviations the ratio is from its mean
- Good for identifying extreme values
- Mean-reverting properties
Min-Max Normalization:
- Scales values between 0 and 1
- Good for relative position within recent range
- More sensitive to recent changes
Percent of All-Time Range:
- Shows where current ratio is relative to all-time highs/lows
- Good for historical context
- Less sensitive to recent changes
Bollinger Band Position:
- Similar to z-score but with adjustable sensitivity
- Good for trading signals
- Can be tuned via standard deviation multiplier
Features:
- Adjustable lookback period
- Reference bands for overbought/oversold levels
- Built-in alerts for extreme values
- Color-coded plots for easy visualization
Skrip open-source
Dengan semangat TradingView yang sesungguhnya, pembuat skrip ini telah menjadikannya sebagai sumber terbuka, sehingga para trader dapat meninjau dan memverifikasi fungsinya. Salut untuk penulisnya! Meskipun Anda dapat menggunakannya secara gratis, perlu diingat bahwa penerbitan ulang kode ini tunduk pada Tata Tertib kami.
Pernyataan Penyangkalan
Informasi dan publikasi ini tidak dimaksudkan, dan bukan merupakan, saran atau rekomendasi keuangan, investasi, trading, atau jenis lainnya yang diberikan atau didukung oleh TradingView. Baca selengkapnya di Ketentuan Penggunaan.