OPEN-SOURCE SCRIPT
Highs and Lows Marker
Indicator Description – Highs and Lows Marker
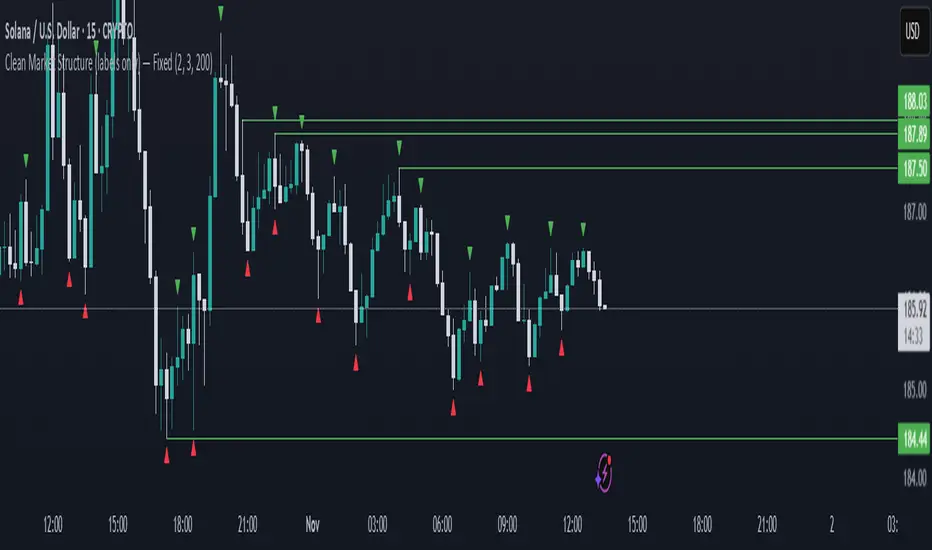
This indicator identifies swing highs and swing lows based on a simple two-candle pattern structure:
High Formation (Swing High):
A High is marked when a bullish candle (Candle Up) is immediately followed by a bearish candle (Candle Down).
The High value is taken as the highest wick price between the two candles in this formation.
This represents a potential short-term resistance or turning point in the market.
Low Formation (Swing Low):
A Low is marked when a bearish candle (Candle Down) is immediately followed by a bullish candle (Candle Up).
The Low value is taken as the lowest wick price between the two candles in this formation.
This represents a potential short-term support or reversal area.
Skrip open-source
Dengan semangat TradingView yang sesungguhnya, pembuat skrip ini telah menjadikannya sebagai sumber terbuka, sehingga para trader dapat meninjau dan memverifikasi fungsinya. Salut untuk penulisnya! Meskipun Anda dapat menggunakannya secara gratis, perlu diingat bahwa penerbitan ulang kode ini tunduk pada Tata Tertib kami.
Pernyataan Penyangkalan
Informasi dan publikasi ini tidak dimaksudkan, dan bukan merupakan, saran atau rekomendasi keuangan, investasi, trading, atau jenis lainnya yang diberikan atau didukung oleh TradingView. Baca selengkapnya di Ketentuan Penggunaan.