OPEN-SOURCE SCRIPT
Diupdate International [interest, exchange] rates
from my blog to quantguy :
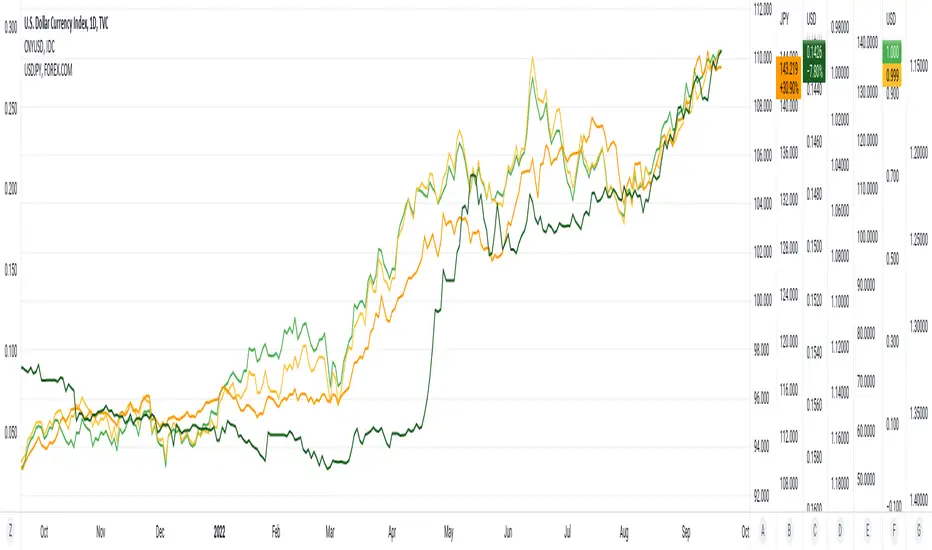
Below are links to a rapid-throw-together set of charts comparing [interest, exchange] rates internationally. There are probably millions of other graphs like this created by organisations and educationals institutes, but far more advanced and accurate. Even so, the graphs show the time relationship between [exchange, interest] rates, and are suggestive of some degree of correlation. No sense pushing this too far, it would be more fun to ferret out more of the network of inter-related factors. One possible current anomaly is the GBPUSD exchange rate?
The charts were generated using a simple PineScript (should be visible?)
// saved graphs - unfortunately, all of the colored labels on the graph were lost!!
// exchange rates are shown by darker colors, interest rates lighter similar colors
// China - green, Euro - purple, Great Britain - blue, Japan - orange (you can see this in the4 code below!)
// stable interest rates : [JP10Y, CN10Y]
// policy-manipulated interest rates : [TNX, EU10Y, GB10Y]
// maybe the "stable rates" countries do more "exchange rate" manipulation?
I haven't put in (min, max) interest rates for time periods EXCEPT for 6month & 1 year. the other periods will be erroneous (eg day, month, 3 month, 5 year, etc)
Catatan Rilis
20Sep2022 - This is an update of yesterday's Pine Script. I have simply provided additional constants for the (3M, 6M) time.periods, adding to constants for (1Y, 5Y) time.periods of yesterday. I did try to implement script to automatically provide the (min, max) of del_CN10Y = v_TNX - v_CN10Y (example), but PineScript does not work on full time-period information accurately, so I abandoned that. Below are links to a rapid-throw-together set of charts comparing rates internationally. There are probably millions of other graphs like this created by organisations and educationals institutes, but far more advanced and accurate. Even so, the graphs show the time relationship between rates, and are suggestive of some degree of correlation. No sense pushing this too far, it would be more fun to ferret out more of the network of inter-related factors. One possible current anomaly is the GBPUSD exchange rate?
// All manually-provided constants for del[Min, Max]_<sym>10Y will become inaccurate with time!!
// ONLY time.periods [3M, 6M, 1Y, 5Y] work.
// time.periods [1D, 5D, 1M, ALL] do NOT work - I haven't manually provided values from charts.
// there are some errors in my manually [read, record] of the 5Y time-periods
// additionally, this Pine Script was thrown together in a day, no rigorous testing
// exchange rates are shown by darker colors, interest rates lighter similar colors
// China - green, Euro - purple, Great Britain - blue, Japan - orange (you can see this in the4 code below!)
// stable rates : [JP10Y, CN10Y]
//
// policy-manipulated rates : [TNX, EU10Y, GB10Y]
//
Skrip open-source
Dengan semangat TradingView yang sesungguhnya, pembuat skrip ini telah menjadikannya sebagai sumber terbuka, sehingga para trader dapat meninjau dan memverifikasi fungsinya. Salut untuk penulisnya! Meskipun Anda dapat menggunakannya secara gratis, perlu diingat bahwa penerbitan ulang kode ini tunduk pada Tata Tertib kami.
Pernyataan Penyangkalan
Informasi dan publikasi ini tidak dimaksudkan, dan bukan merupakan, saran atau rekomendasi keuangan, investasi, trading, atau jenis lainnya yang diberikan atau didukung oleh TradingView. Baca selengkapnya di Ketentuan Penggunaan.