OPEN-SOURCE SCRIPT
Slope Indicator of Highest Highs and Lowest Lows
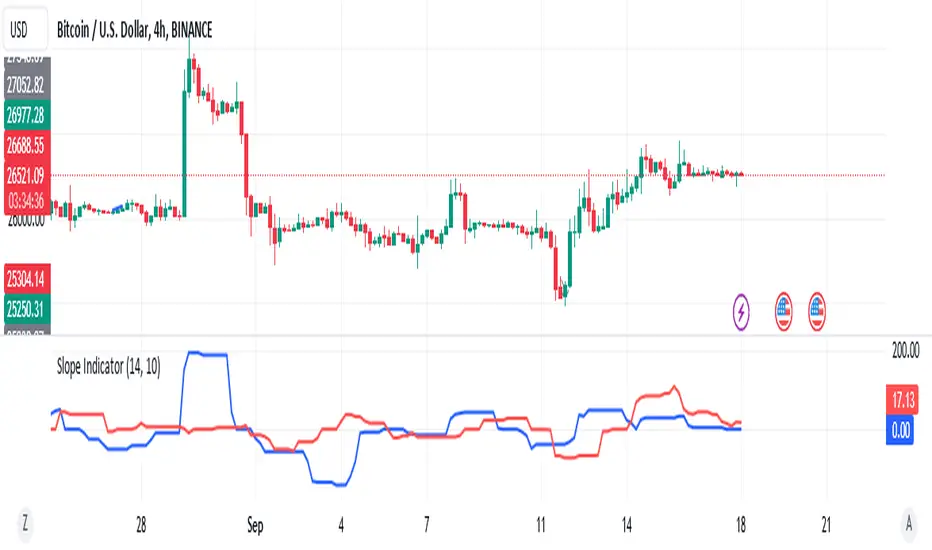
In this example, the indicator calculates the slope between the highest high value of the current period and the highest high value candles bars ago. The result is plotted on the chart as a line.
And this example calculates the slope between the lowest low value of the current period and the lowest low value candles bars ago. It then plots the slope on the chart using a red line.
Feel free to adjust the input parameters and modify the code to fit your specific requirements. If you have any more questions or need further assistance, feel free to ask!
Skrip open-source
Dengan semangat TradingView yang sesungguhnya, pembuat skrip ini telah menjadikannya sebagai sumber terbuka, sehingga para trader dapat meninjau dan memverifikasi fungsinya. Salut untuk penulisnya! Meskipun Anda dapat menggunakannya secara gratis, perlu diingat bahwa penerbitan ulang kode ini tunduk pada Tata Tertib kami.
Pernyataan Penyangkalan
Informasi dan publikasi ini tidak dimaksudkan, dan bukan merupakan, saran atau rekomendasi keuangan, investasi, trading, atau jenis lainnya yang diberikan atau didukung oleh TradingView. Baca selengkapnya di Ketentuan Penggunaan.