OPEN-SOURCE SCRIPT
TKP RSI BAR COLOR
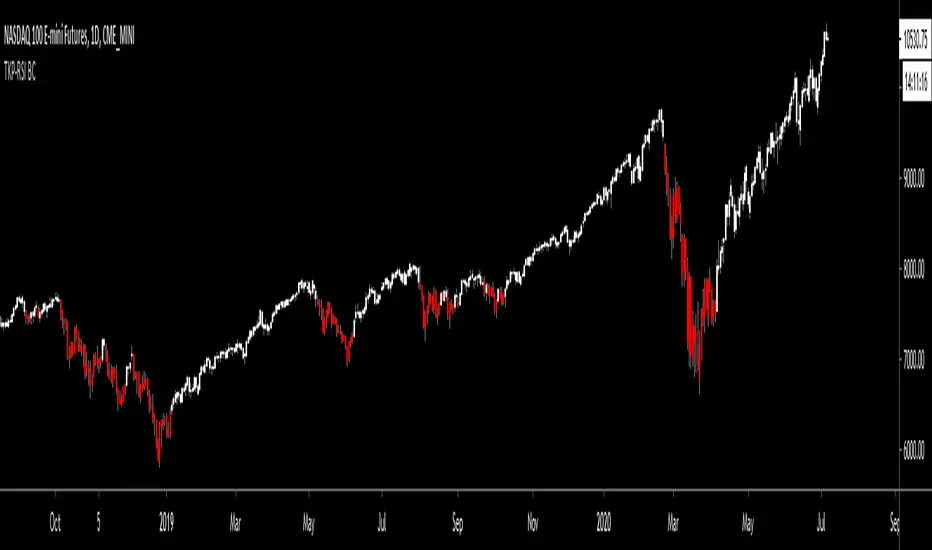
This script was influenced by Scilentor's- "RSI Bar Colors / Scilentor". I improved upon the Idea by adding the ability to change the full range of RSI (Between 0 through 100) to any color you want within 5 point increments.
Traditional use of RSI is to use it as an "Overbought" and "Oversold" indicator. A more uncommon/unknown use, especially among new traders, is to use is as a "Momentum" indicator. I personally like to look for stocks where RSI>50
Default settings are set to color all bars red when below 50, and white when above 50, but try for your self setting different colors above 70, and below 30 to better see overbought and oversold conditions. I got a lot of requests for this script and I hope it helps you in your trading journey :-)
Skrip open-source
Dengan semangat TradingView yang sesungguhnya, pembuat skrip ini telah menjadikannya sebagai sumber terbuka, sehingga para trader dapat meninjau dan memverifikasi fungsinya. Salut untuk penulisnya! Meskipun Anda dapat menggunakannya secara gratis, perlu diingat bahwa penerbitan ulang kode ini tunduk pada Tata Tertib kami.
Pernyataan Penyangkalan
Informasi dan publikasi ini tidak dimaksudkan, dan bukan merupakan, saran atau rekomendasi keuangan, investasi, trading, atau jenis lainnya yang diberikan atau didukung oleh TradingView. Baca selengkapnya di Ketentuan Penggunaan.