PROTECTED SOURCE SCRIPT
TEXAS 2 Step RSI-2 - Alerts Built-in

Be sure to Add to Favorites (down below) and/or Like/Follow this script so that you will be alerted to UPDATES.
Adding to Favorites makes it available in your list of Indicators.
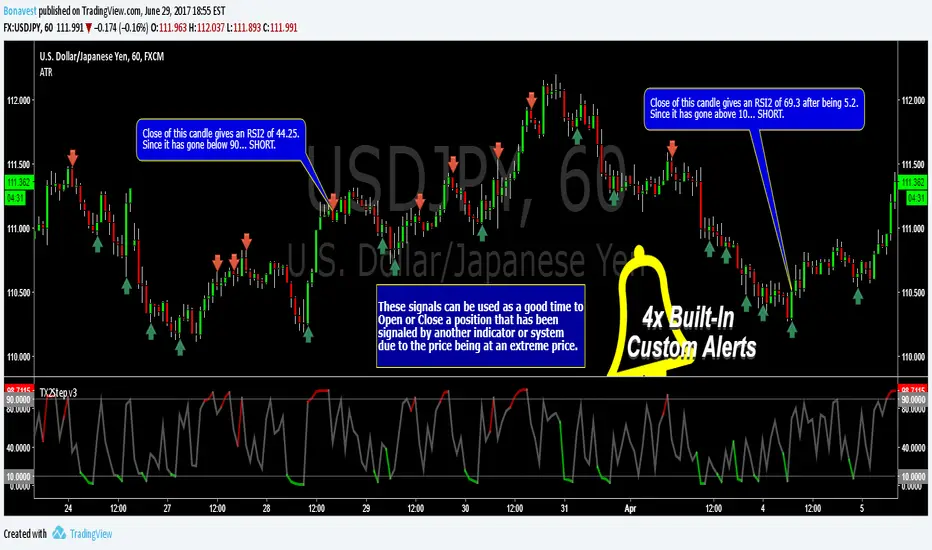
The Texas 2 Step is a lower indicator (arrows on candles added for reference) based on the RSI-2 Strategy made famous by Larry Connors.
I use this indicator for:
I use this indicator by looking for the RSI-2 number going back inside the 10-90 range(gray) after being outside (red/green). This tells me the price is no longer at an extreme. You never know how many candles will remain in the extreme areas so wait for a candle to close inside the range.
On longer time frames (daily/weekly) you will notice several candles will stay in the extreme areas resulting in 100 pips or more before returning to the inside range. In these cases you can go LONG/SHORT in the direction of the extreme area and close your position once it returns to the inside range.
There are 4 Built-In Notifications already created for you and are available by simply right clicking in the indicator area and selecting:
Condition: TX2Step v3 - RSI
Then 1 of the 4 Alerts:
Green Alert - RSI2 > 90 and line turns Green
Red Alert - RSI2 < 10 and line turns Red
Down - RSI2 < 90 after being in the top RSI2 > 90 area
Up - RSI2 > 10 after being in the bottom RSI2 < 10 area
I look forward to hearing your thoughts on the indicator and will definitely like to build upon this indicator and continue to update it.
This adaptation was based off of the original code from the talented Chris Moody.
Plenty of additional information about Larry Connors RSI-2 Strategy with PDFs and Backtests in the stock markets on the original Script.

Adding to Favorites makes it available in your list of Indicators.
The Texas 2 Step is a lower indicator (arrows on candles added for reference) based on the RSI-2 Strategy made famous by Larry Connors.
I use this indicator for:
- Timing Entries and Exits
- Trading Between Up/Ddown Signals
- Detecting Trends and Pull Backs
I use this indicator by looking for the RSI-2 number going back inside the 10-90 range(gray) after being outside (red/green). This tells me the price is no longer at an extreme. You never know how many candles will remain in the extreme areas so wait for a candle to close inside the range.
On longer time frames (daily/weekly) you will notice several candles will stay in the extreme areas resulting in 100 pips or more before returning to the inside range. In these cases you can go LONG/SHORT in the direction of the extreme area and close your position once it returns to the inside range.
There are 4 Built-In Notifications already created for you and are available by simply right clicking in the indicator area and selecting:
Condition: TX2Step v3 - RSI
Then 1 of the 4 Alerts:
Green Alert - RSI2 > 90 and line turns Green
Red Alert - RSI2 < 10 and line turns Red
Down - RSI2 < 90 after being in the top RSI2 > 90 area
Up - RSI2 > 10 after being in the bottom RSI2 < 10 area
I look forward to hearing your thoughts on the indicator and will definitely like to build upon this indicator and continue to update it.
This adaptation was based off of the original code from the talented Chris Moody.
Plenty of additional information about Larry Connors RSI-2 Strategy with PDFs and Backtests in the stock markets on the original Script.

Skrip terproteksi
Skrip ini diterbitkan sebagai sumber tertutup. Namun, Anda dapat menggunakannya dengan bebas dan tanpa batasan apa pun – pelajari lebih lanjut di sini.
Pernyataan Penyangkalan
Informasi dan publikasi ini tidak dimaksudkan, dan bukan merupakan, saran atau rekomendasi keuangan, investasi, trading, atau jenis lainnya yang diberikan atau didukung oleh TradingView. Baca selengkapnya di Ketentuan Penggunaan.