Volume Trend Analysis Pro
High-Accuracy Volume Blast • Breakout Model • Wyckoff Spring/Upthrust • Trend-Volume Matrix • SIVA Volume Analyzer
🧩 1. Overview
VBA Pro is a complete volume-based trading system that detects:
🔥 Volume Blasts (Bull/Bear/Neutral)
📈 True & False Breakouts
🟦 Wyckoff Springs & Upthrusts
📊 Trend–Volume Matrix (11×11 system)
🟪 SIVA Volume Analyzer states
🟧 Volume Spike events
🔍 Multi-filter confirmation
This tool identifies both momentum continuation and manipulation-based reversals, making it ideal for intraday, swing, and SMC/Wyckoff traders.
🟦 2. Core Components:
A. Volume Blast Detector
Triggered when any of these filters activate:
- RVOL Blast (Relative Volume explosion)
- Range Blast (Large candle body + large volume)
- Volume × ATR Blast (Volatility-weighted volume surge)
Color System (by direction):
🟢 Bullish Blast
🔴 Bearish Blast
⚪ Neutral Blast
B. Wyckoff Model (Spring & Upthrust)
Automatically identifies:
- Spring → Bullish liquidity sweep + reversal context
- Upthrust → Bearish liquidity sweep + reversal context
Tooltip includes:
✔ Liquidity sweep
✔ Support/Resistance test
✔ Exhaustion or aggressive absorption
✔ Reversal probability
C. Breakout Detector (True/False)
True Breakout when:
- Volume strong
- Candle closes beyond levels
- Trend aligned
- No rejection wick
False Breakout when:
- Wick rejection
- Low confirmation volume
- Immediate rejection back inside range
Plot:
- TrBu → True Bull Breakout
- TrBe → True Bear Breakout
- ❌ False Breakouts (Bull/Bear)
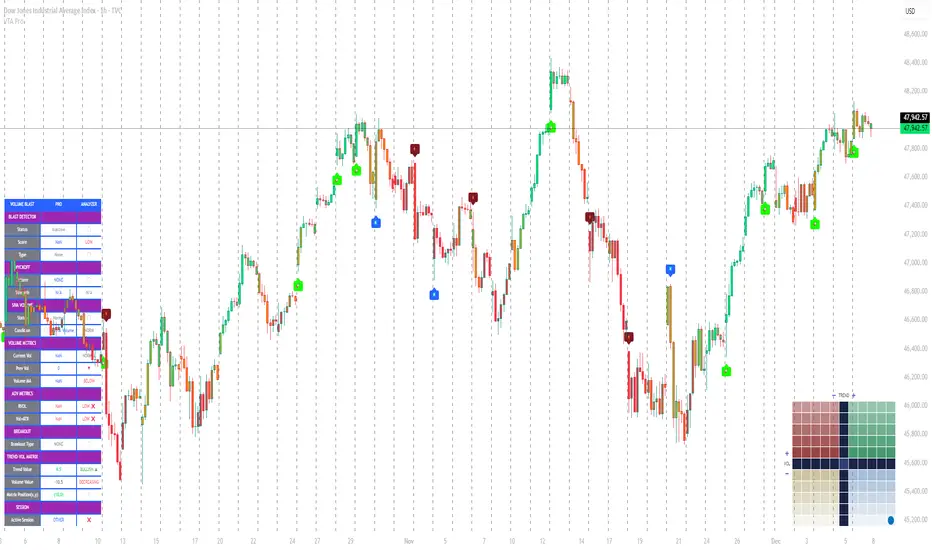
D. Trend–Volume Matrix (TVM 11×11)
- Plots real-time market structure using:
- Trend Value (–10 → +10)
- Volume Value (–10 → +10)
Quadrants show:
- Trend Continuation (Top-Right)
- Volume Divergence (Top-Left)
- Weakening Trend (Bottom-Right)
- Distribution / Manipulation (Bottom-Left)
Volume Trend Matrix shows where the market is sitting:
- Top Right (green): Trend ↑ and Volume ↑ → strong confirmed up trend.
- Top Left (red): Trend ↓ but Volume ↑ → strong sell momentum.
- Bottom Right (blue): Trend ↑ but Volume ↓ → uptrend losing steam.
- Bottom Left (yellow): Trend ↓ and Volume ↓ → weak bearish drift.
- Dynamic Candle Coloring: Candles are colored by trend only: green for uptrends, red for downtrends, and orange near reversals.
- Threshold Fills: The oscillator region is shaded green above +10 (healthy uptrend) and red
below -10 (strong downtrend) for instant confidence.
E. SIVA Volume Analyzer
Color-coded volume states:
🔥 Volume Spike
🟢 Higher Volume
🔴 Lower Volume
🟣 Extremely Low Volume
⚪ Neutral
🟩/🟥 Trend-confirming Volume
📈 3. Trading Examples
🔵 Bullish Setup:
- Spring detected
- Bullish Blast
- Trend Value > 0
- True Bull Breakout (optional)
- Liquidity confirmation
🔴 Bearish Setup:
- Upthrust detected
- Bearish Blast
- Trend Value < 0
- True Bear Breakout
- Weak volume pullback
🔔 4. Alerts
Alerts trigger for:
- Volume Blast
- Spring / Upthrust
- Volume Spike
- True & False Breakouts
- Liquidity engagement
- Trend–Volume quadrant changes
🛠 5. Settings Guide
All modules can be toggled independently:
- Volume Blast Detector
- Wyckoff Model
- Breakout Model
- Volume Spike Detector
- Trend–Volume Matrix
- Candle Colors
- Label Shapes
🧠 6. Best Practices
- Combine Trend–Volume Matrix + Blast for best confirmation
- Avoid trading during neutral/grayed volume states
- Springs/Upthrusts are strongest after consolidation
- Use Breakout Model to avoid fakeouts
Skrip hanya-undangan
Hanya pengguna yang disetujui oleh penulis yang dapat mengakses skrip ini. Anda perlu meminta dan mendapatkan izin untuk menggunakannya. Izin ini biasanya diberikan setelah pembayaran. Untuk detail selengkapnya, ikuti petunjuk penulis di bawah ini atau hubungi ask2maniish secara langsung.
TradingView TIDAK menyarankan untuk membayar atau menggunakan skrip kecuali Anda sepenuhnya mempercayai pembuatnya dan memahami cara kerjanya. Anda juga dapat menemukan alternatif yang gratis dan sumber terbuka di skrip komunitas kami.
Instruksi penulis
Pernyataan Penyangkalan
Skrip hanya-undangan
Hanya pengguna yang disetujui oleh penulis yang dapat mengakses skrip ini. Anda perlu meminta dan mendapatkan izin untuk menggunakannya. Izin ini biasanya diberikan setelah pembayaran. Untuk detail selengkapnya, ikuti petunjuk penulis di bawah ini atau hubungi ask2maniish secara langsung.
TradingView TIDAK menyarankan untuk membayar atau menggunakan skrip kecuali Anda sepenuhnya mempercayai pembuatnya dan memahami cara kerjanya. Anda juga dapat menemukan alternatif yang gratis dan sumber terbuka di skrip komunitas kami.