OPEN-SOURCE SCRIPT
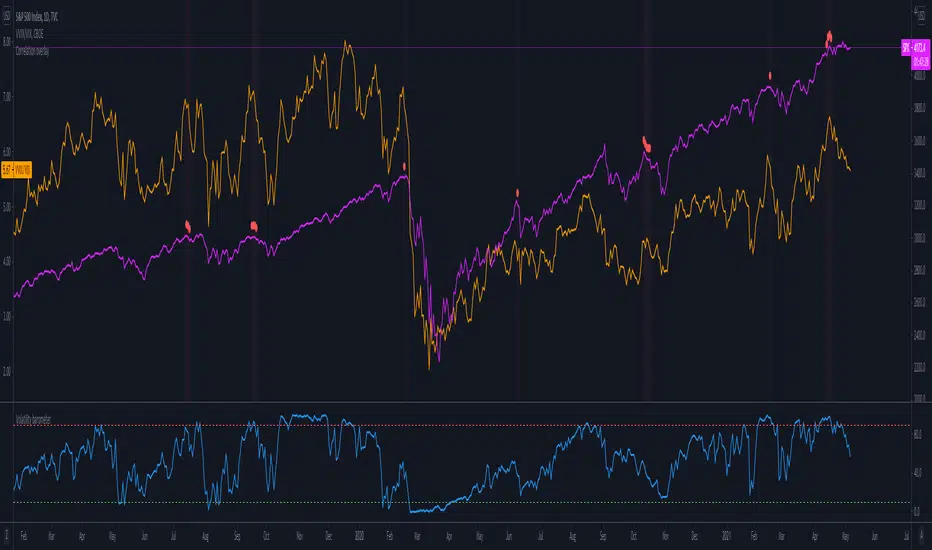
Volatility barometer

It is the indicator that analyzes the behaviour of VIX against CBOE volaility indices (VIX3M, VIX6M and VIX1Y) and VIX futures (next contract to the front one - VX!2). Because VIX is a derivate of SPX, the indicator shall be used on the SPX chart (or equivalent like SPY).
When the readings get above 90 / below 10, it means the market is overbought / oversold in terms of implied volatility. However, it does not mean it will reverse - if the price go higher along with the indicator readings then everything is fine. There is an alarming situation when the SPX is diverging - e.g. the price go higher, the readings lower. It means the SPX does not play in the same team as IVOL anymore and might reverse.
You can use it in conjunction with other implied volatility indicators for stronger signals: the Correlation overlay ( - the indicator that measures the correlation between VVIX and VIX) and VVIX/VIX ratio (it generates a signal the ratio makes 50wk high).
When the readings get above 90 / below 10, it means the market is overbought / oversold in terms of implied volatility. However, it does not mean it will reverse - if the price go higher along with the indicator readings then everything is fine. There is an alarming situation when the SPX is diverging - e.g. the price go higher, the readings lower. It means the SPX does not play in the same team as IVOL anymore and might reverse.
You can use it in conjunction with other implied volatility indicators for stronger signals: the Correlation overlay (

Skrip open-source
Dengan semangat TradingView yang sesungguhnya, pembuat skrip ini telah menjadikannya sebagai sumber terbuka, sehingga para trader dapat meninjau dan memverifikasi fungsinya. Salut untuk penulisnya! Meskipun Anda dapat menggunakannya secara gratis, perlu diingat bahwa penerbitan ulang kode ini tunduk pada Tata Tertib kami.
Pernyataan Penyangkalan
Informasi dan publikasi ini tidak dimaksudkan, dan bukan merupakan, saran atau rekomendasi keuangan, investasi, trading, atau jenis lainnya yang diberikan atau didukung oleh TradingView. Baca selengkapnya di Ketentuan Penggunaan.