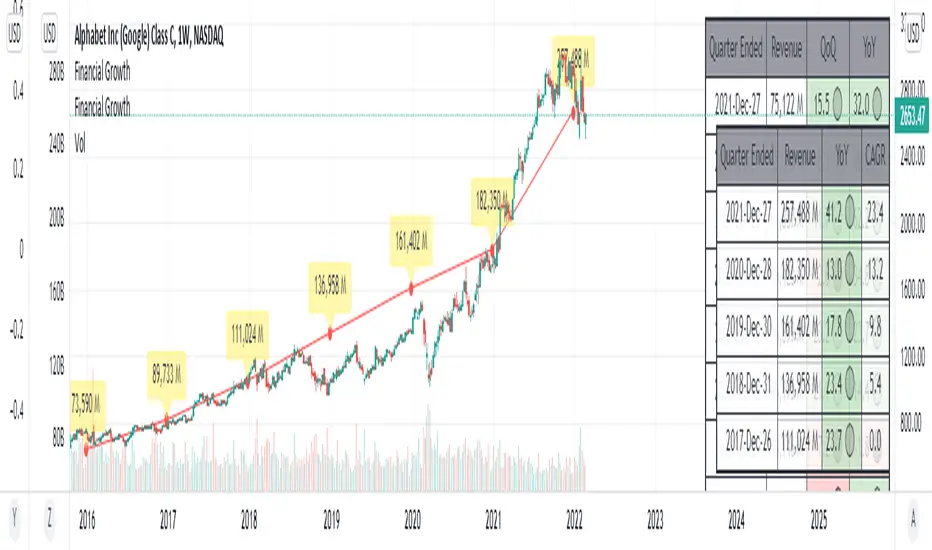
This indicator will acquire the financial data provided by Tradview.
the data is compare between Quarter, Annual and TTM in term of percent of growth.
YoY, QoQ and CAGR is also available by this script (The minimum is 4).
in addition, ploting of data, label and table also available (you can check the mark to toggle on / off).
Data : Revenue, Net Income, EBITDA, EPS, DVPS, Free Cash Flow and Forward PE .
How to use it.
just select the financial data, period and size of data to compare.
you can check the box to toggle the plotting line, label and table.
Enjoy.
Catatan Rilis
Fix comparison calculations Catatan Rilis
- More items added. - fixed CAGR.
New Items Added
- Key Financial Number : Revenue, Net Income, EBITDA, EPS, DVPS, Free Cash Flow, Total Debt
- Key Financial Ratio : Gross Margin, EBITDA Margin, Net Margin, ROE, ROA, Price to Book Value (P/BV), Price to Earnings (P/E)
Catatan Rilis
Update Detail : 2022-Dec-17- Add 2 financial items.
- Add eps, diluted.
- Re-arrange code.
Catatan Rilis
Re-arranged code. Add more items related to debt.
Catatan Rilis
there's some problem about version.so i updated again.
Skrip open-source
Dengan semangat TradingView yang sesungguhnya, pembuat skrip ini telah menjadikannya sebagai sumber terbuka, sehingga para trader dapat meninjau dan memverifikasi fungsinya. Salut untuk penulisnya! Meskipun Anda dapat menggunakannya secara gratis, perlu diingat bahwa penerbitan ulang kode ini tunduk pada Tata Tertib kami.
Pernyataan Penyangkalan
Informasi dan publikasi ini tidak dimaksudkan, dan bukan merupakan, saran atau rekomendasi keuangan, investasi, trading, atau jenis lainnya yang diberikan atau didukung oleh TradingView. Baca selengkapnya di Ketentuan Penggunaan.
