PROTECTED SOURCE SCRIPT
9/13/00 Pivots [Rainbow Trends]

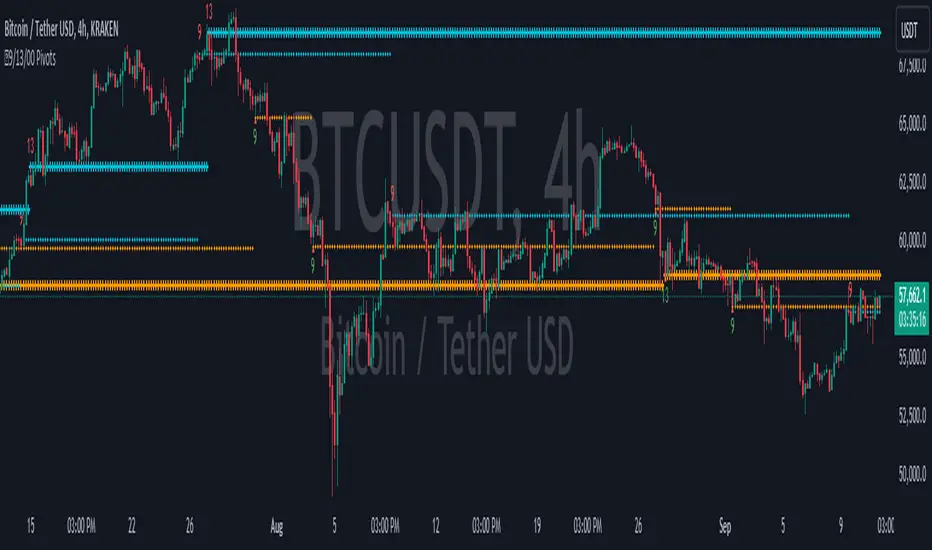
The 9/13/00 Pivot indicator is a tool that is able to highlight support and resistance levels in relation to the 9, 13 and extended counts of the trending price action. While numerous traders trade the 9/13 counts, this tool is unique in that it continues counting past the 9 level and will mark extended runs coming to an end with a vertical Red or Green Column.
The indicator identifies levels based on both 9,13 and extended counts, but splits them into both Support and Resistance levels and marks each level with a horizontal pivot. The level being Support/Resistance can be determined by the colors of the pivot. In addition, this tool Note that these styles of pivots and colors can be edited in the tool settings.
This calculation is based on the value of the current close compared to the close that happened 4 candles back.
Condition: sequence := close > close[4]
Pine Script®
When this condition is true for 9 or 13 consecutive closes in a row, the indicator will mark the candle with the current number count as well as drawing a horizontal pivot to indicate the importance of the price level.
Sequences

Pivots

Extended Trends Ending/Exhausting

Annotated Chart

Annotated Extended Trends Ending/Exhausting

Scalp Trading Zone

Settings

Toggle Settings - Allows each visual aspect of the indicator to be enabled/disabled.
Pivot Color Settings - Allows the trader to custom tune the colors for their own style.
Candle Settings - The candles are individually marked color wise to visually draw the user's eyes to the change in candle color.
The indicator identifies levels based on both 9,13 and extended counts, but splits them into both Support and Resistance levels and marks each level with a horizontal pivot. The level being Support/Resistance can be determined by the colors of the pivot. In addition, this tool Note that these styles of pivots and colors can be edited in the tool settings.
This calculation is based on the value of the current close compared to the close that happened 4 candles back.
Condition: sequence := close > close[4]
seq := close > close[4]
When this condition is true for 9 or 13 consecutive closes in a row, the indicator will mark the candle with the current number count as well as drawing a horizontal pivot to indicate the importance of the price level.
Sequences
Pivots
Extended Trends Ending/Exhausting
Annotated Chart
Annotated Extended Trends Ending/Exhausting
Scalp Trading Zone
Settings
Toggle Settings - Allows each visual aspect of the indicator to be enabled/disabled.
Pivot Color Settings - Allows the trader to custom tune the colors for their own style.
Candle Settings - The candles are individually marked color wise to visually draw the user's eyes to the change in candle color.
Skrip terproteksi
Skrip ini diterbitkan sebagai sumber tertutup. Namun, Anda dapat menggunakannya dengan bebas dan tanpa batasan apa pun – pelajari lebih lanjut di sini.
Access our +10,000 lines of code that put you ahead in the markets at RainbowTrends.com 🐋
Pernyataan Penyangkalan
Informasi dan publikasi ini tidak dimaksudkan, dan bukan merupakan, saran atau rekomendasi keuangan, investasi, trading, atau jenis lainnya yang diberikan atau didukung oleh TradingView. Baca selengkapnya di Ketentuan Penggunaan.