PROTECTED SOURCE SCRIPT
Diupdate Static Square & Cube Levels
Square & Cube Levels - Mathematical Price Support/Resistance
Description
This indicator plots horizontal lines at mathematically significant Square Numbers (1², 2², 3²...) and Cube Numbers (1³, 2³, 3³...) as static price levels on your chart. These mathematical levels often act as psychological support and resistance zones in financial markets.
Key Features
Square Levels: 1, 4, 9, 16, 25, 36, 49, 64, 81, 100...
Cube Levels: 1, 8, 27, 64, 125, 216, 343, 512...
Dual Configuration: Independent controls for squares and cubes
Customizable Colors: Different colors for square vs cube levels
Flexible Settings: Adjustable line width, style, and extension
Smart Labels: Clear identification of each level (e.g., "3² = 9", "4³ = 64")
Toggle Controls: Enable/disable squares or cubes independently
Use Cases
Support/Resistance Trading: Mathematical levels often act as psychological price barriers
Entry/Exit Points: Use levels for precise trade entries and profit targets
Price Analysis: Identify potential turning points at mathematically significant prices
Multi-Asset Trading: Works on any asset where these price levels are relevant
Settings
Square Levels: Max number (1-50), color, line width, labels on/off
Cube Levels: Max number (1-20), color, line width, labels on/off
Line Style: Solid, dashed, or dotted
Extension: None, left, right, or both directions
Best For
Stocks, forex pairs, and cryptocurrencies trading in ranges where these mathematical levels provide meaningful support/resistance zones. Particularly effective on assets with prices between $1-$1000 range.
Note: Cube numbers grow exponentially (1, 8, 27, 64, 125...), so adjust the maximum cube number based on your asset's price range for optimal visibility.
Catatan Rilis
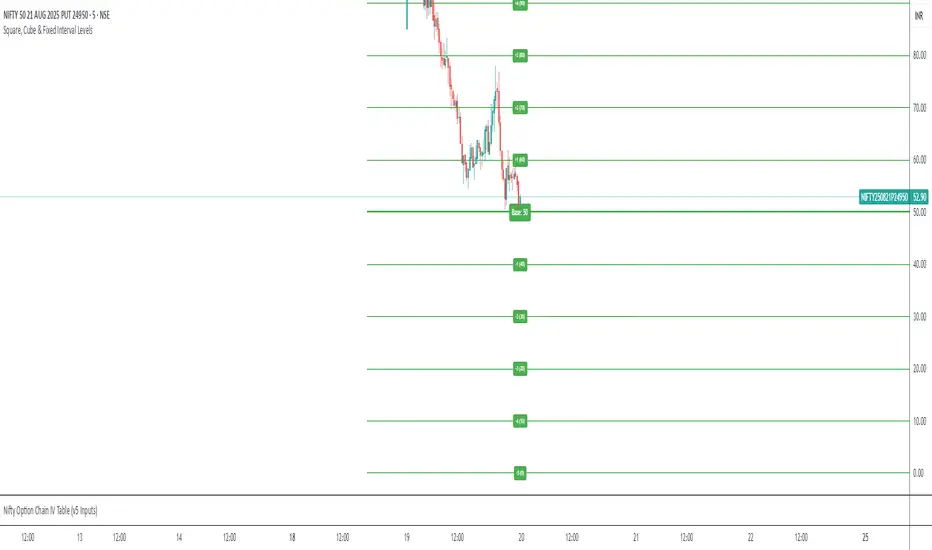
Square, Cube & Fixed Interval Levels - Complete Mathematical & Custom Price Level ToolDescription
This comprehensive indicator combines three powerful level systems in one tool: Mathematical Square Numbers, Cube Numbers, and Custom Fixed Interval lines. Draw static horizontal lines at mathematically significant levels plus your own custom price intervals for complete support/resistance analysis.
Features
Square Levels (1², 2², 3²...)
Static lines at: 1, 4, 9, 16, 25, 36, 49, 64, 81, 100...
Mathematical support/resistance levels
Customizable color, width, and labels
Cube Levels (1³, 2³, 3³...)
Static lines at: 1, 8, 27, 64, 125, 216, 343, 512...
Exponential mathematical levels
Independent styling from square levels
Fixed Interval Lines
Custom spacing from any base price you choose
Bidirectional: Set different numbers of lines above and below base
Perfect for: Round numbers ($10, $50, $100), options strikes, psychological levels
Example: Base $100, $25 intervals → Lines at $25, $50, $75, $100, $125, $150, $175...
Key Settings
Independent Controls: Enable/disable each system separately
Custom Colors: Different colors for squares, cubes, and intervals
Flexible Styling: Line width, style (solid/dashed/dotted), extension options
Smart Labels: Clear identification of each level type
Base Price Selection: Choose your reference point for interval lines
Custom Spacing: Any interval size (0.5, 10, 25, 100, etc.)
Use Cases
Support/Resistance Trading: Multiple level confirmation systems
Options Trading: Strike price intervals with mathematical levels
Psychological Levels: Round number analysis combined with mathematical zones
Multi-Timeframe Analysis: Static levels work across all timeframes
Entry/Exit Planning: Precise level-based trading strategies
Perfect For
All asset classes where these price levels provide meaningful reference points. Particularly effective for stocks ($1-$1000 range), forex major pairs, and cryptocurrency trading.
Pro Tip: Use different colors for each system - blue for squares, red for cubes, green for your custom intervals - for instant visual identification of level types.
Skrip terproteksi
Skrip ini diterbitkan sebagai sumber tertutup. Namun, Anda dapat menggunakannya dengan bebas dan tanpa batasan apa pun – pelajari lebih lanjut di sini.
Pernyataan Penyangkalan
Informasi dan publikasi ini tidak dimaksudkan, dan bukan merupakan, saran atau rekomendasi keuangan, investasi, trading, atau jenis lainnya yang diberikan atau didukung oleh TradingView. Baca selengkapnya di Ketentuan Penggunaan.