OPEN-SOURCE SCRIPT
Stochastic/LSMA
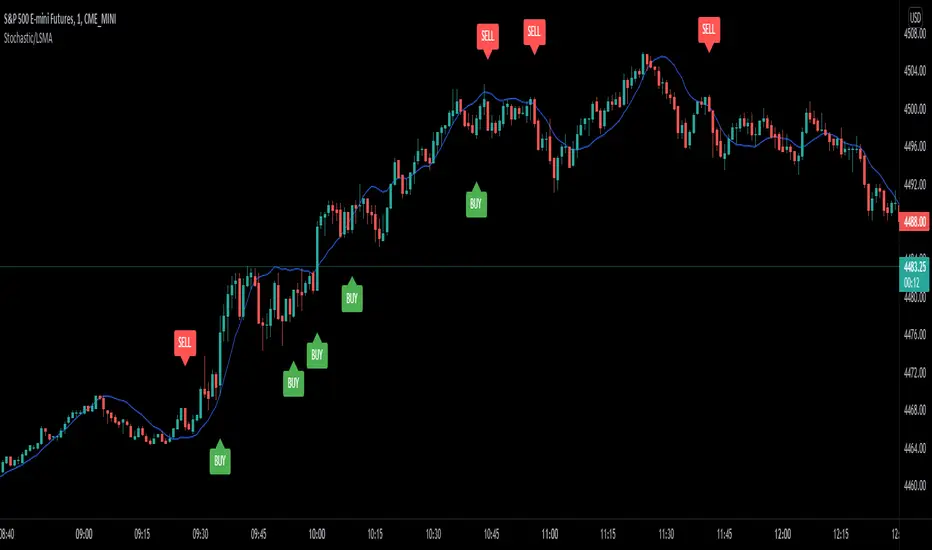
This is the Stochastic/LSMA Buy and Sell indicator. The Buy signal is generated when the %K line crosses up above the %D line from the stochastics while the signal candle is green and has come after a red candle. The Sell signal is generated when the %K line crosses down below the %D line from the stochastics while the signal candle is red and has come after a green candle. The default settings are %K Length is 5, the %K Smoothing is 3, and the %D Smoothing is 3 with the LSMA period being 30. I use this indicator to scalp 2 points at a time on the E-Mini (ES) on a 1 minute timeframe. I like to use a stop loss of 2 points and a target of 2 points. The LSMA helps to reduce fake signals and should also be used to see the overall trend. I hope this helps.
Skrip open-source
Dengan semangat TradingView yang sesungguhnya, pembuat skrip ini telah menjadikannya sebagai sumber terbuka, sehingga para trader dapat meninjau dan memverifikasi fungsinya. Salut untuk penulisnya! Meskipun Anda dapat menggunakannya secara gratis, perlu diingat bahwa penerbitan ulang kode ini tunduk pada Tata Tertib kami.
Pernyataan Penyangkalan
Informasi dan publikasi ini tidak dimaksudkan, dan bukan merupakan, saran atau rekomendasi keuangan, investasi, trading, atau jenis lainnya yang diberikan atau didukung oleh TradingView. Baca selengkapnya di Ketentuan Penggunaan.