PROTECTED SOURCE SCRIPT
1H / 1D / 1W Çoklu Zaman Ölçekli Destek–Direnç (Reg Kanal Özeti)
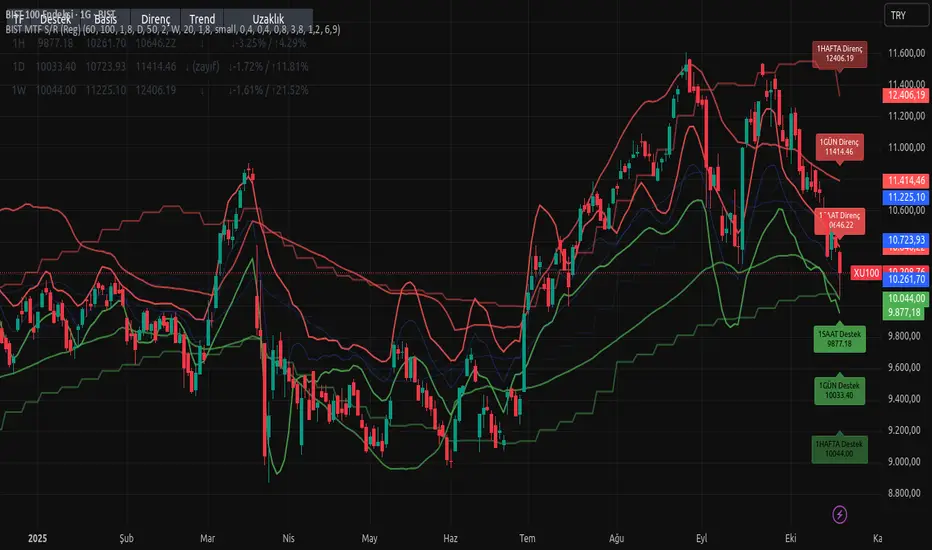
Multi-Timeframe Regression Channel — Support & Resistance Map
This indicator automatically plots regression-based support and resistance levels for three major timeframes — 1H (short-term traders), 1D (swing traders), and 1W (long-term investors) — all displayed on the same chart.
It combines linear regression channels and standard deviation offsets to reveal the active trend and volatility structure across multiple time horizons.
Each timeframe includes:
Upper band (Resistance) — potential selling or overextension zone
Basis line (Regression mean) — fair-value trend midpoint
Lower band (Support) — potential accumulation or reaction zone
A summary table in the top-left corner shows current levels, slope direction (↑ / ↓ / →), RSI-based strength notes, and percentage distances to each band.
All levels auto-update with the latest data, regardless of the chart timeframe.
Ideal for:
Multi-timeframe confluence analysis
Swing trading setups and breakout confirmations
Trend-following or mean-reversion strategies
✅ Tip:
When price holds above the lower band, the structure remains bullish.
A clean break above resistance often signals momentum continuation, while a close below support can mark a trend weakening.
Skrip terproteksi
Skrip ini diterbitkan sebagai sumber tertutup. Namun, anda dapat menggunakannya secara bebas dan tanpa batasan apa pun – pelajari lebih lanjut di sini.
Pernyataan Penyangkalan
Informasi dan publikasi tidak dimaksudkan untuk menjadi, dan bukan merupakan saran keuangan, investasi, perdagangan, atau rekomendasi lainnya yang diberikan atau didukung oleh TradingView. Baca selengkapnya di Persyaratan Penggunaan.