OPEN-SOURCE SCRIPT
MTF Round Level Reversal [RunRox]
🧲 MTF Round Level Reversal is an indicator designed to highlight price levels on the chart where the market encountered significant resistance or support at round numbers, failing to break through large clusters of orders.
In many cases, price revisits these round-number levels to absorb the remaining liquidity, offering potential reversal or continuation trade opportunities.
✏️ EXAMPLE

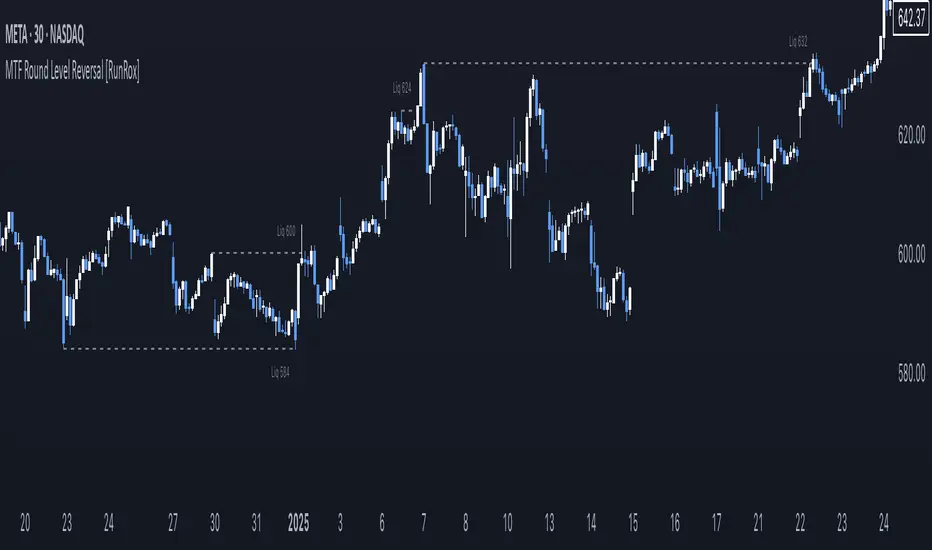
Here’s an example demonstrating how this indicator works and how its logic is structured:
As shown in the screenshot above, price encountered resistance at round-number levels, clearly reacting off these areas.
Afterward, the market pulled back, presenting opportunities to enter trades targeting these previously established open levels.
This logic is based on the observation that price often seeks to revisit these open round-number levels due to the residual liquidity resting there.
While effective across various markets, this indicator performs particularly well with stocks or assets priced at higher values.

For a level to appear on the chart, price must first encounter a round-number value and clearly reverse from it, leaving a visible reaction on the chart. After this occurs, the indicator will mark this level as fully formed and display it as an active reversal area.
⚙️ SETTINGS

🔷 Timeframe – Choose any timeframe from which you’d like the indicator to source level data.
🔷 Period – Defines the number of candles required on both sides (left and right) to confirm and fully form a level.
🔷 Rounding Level – Adjusts price rounding precision when detecting levels (from 0.0001 up to 5000).
🔷 Color – Customize the color and transparency of displayed levels.
🔷 Line Style – Select the desired line style for level visualization.
🔷 Label Size – Set the font size for the level labels displayed on the chart.
🔷 Move Label to the Right – Move level labels to the right side of the screen for better visibility.
🔷 Label Offset – Specifies how many bars labels should be offset from the chart’s right edge.
🔷 Delete Filled Level – Automatically removes levels from the chart after they’ve been revisited or filled.
🔷 Calculation Bars – Determines the number of recent bars considered when calculating and identifying levels.
🔶 There are numerous ways to apply this indicator in your trading strategy. You can look for trades targeting these round-number levels or identify reversal setups forming at these high-liquidity zones. The key insight is understanding that these levels represent significant liquidity areas, which price frequently revisits and retests.
We greatly appreciate your feedback and suggestions to further improve and enhance this indicator!
In many cases, price revisits these round-number levels to absorb the remaining liquidity, offering potential reversal or continuation trade opportunities.
✏️ EXAMPLE
Here’s an example demonstrating how this indicator works and how its logic is structured:
As shown in the screenshot above, price encountered resistance at round-number levels, clearly reacting off these areas.
Afterward, the market pulled back, presenting opportunities to enter trades targeting these previously established open levels.
This logic is based on the observation that price often seeks to revisit these open round-number levels due to the residual liquidity resting there.
While effective across various markets, this indicator performs particularly well with stocks or assets priced at higher values.
For a level to appear on the chart, price must first encounter a round-number value and clearly reverse from it, leaving a visible reaction on the chart. After this occurs, the indicator will mark this level as fully formed and display it as an active reversal area.
⚙️ SETTINGS
🔷 Timeframe – Choose any timeframe from which you’d like the indicator to source level data.
🔷 Period – Defines the number of candles required on both sides (left and right) to confirm and fully form a level.
🔷 Rounding Level – Adjusts price rounding precision when detecting levels (from 0.0001 up to 5000).
🔷 Color – Customize the color and transparency of displayed levels.
🔷 Line Style – Select the desired line style for level visualization.
🔷 Label Size – Set the font size for the level labels displayed on the chart.
🔷 Move Label to the Right – Move level labels to the right side of the screen for better visibility.
🔷 Label Offset – Specifies how many bars labels should be offset from the chart’s right edge.
🔷 Delete Filled Level – Automatically removes levels from the chart after they’ve been revisited or filled.
🔷 Calculation Bars – Determines the number of recent bars considered when calculating and identifying levels.
🔶 There are numerous ways to apply this indicator in your trading strategy. You can look for trades targeting these round-number levels or identify reversal setups forming at these high-liquidity zones. The key insight is understanding that these levels represent significant liquidity areas, which price frequently revisits and retests.
We greatly appreciate your feedback and suggestions to further improve and enhance this indicator!
Skrip open-source
Dengan semangat TradingView yang sesungguhnya, pembuat skrip ini telah menjadikannya sebagai sumber terbuka, sehingga para trader dapat meninjau dan memverifikasi fungsinya. Salut untuk penulisnya! Meskipun Anda dapat menggunakannya secara gratis, perlu diingat bahwa penerbitan ulang kode ini tunduk pada Tata Tertib kami.
Access RunRox premium indicators: RunRox.com/tv
Join our FREE Discord for Strategy, Live Translation and more: discord.gg/RunRox
Join our FREE Discord for Strategy, Live Translation and more: discord.gg/RunRox
Pernyataan Penyangkalan
Informasi dan publikasi ini tidak dimaksudkan, dan bukan merupakan, saran atau rekomendasi keuangan, investasi, trading, atau jenis lainnya yang diberikan atau didukung oleh TradingView. Baca selengkapnya di Ketentuan Penggunaan.