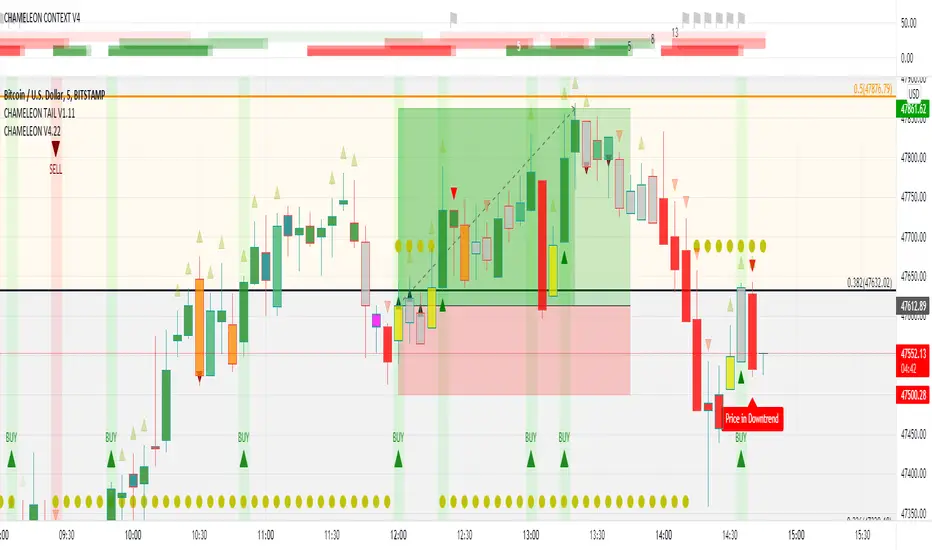
CHAMELEON V3

CHAMELEON:
V3 update contains more accurate conditional logic filtering
=================
A price action candle color changing indicator which adds valuable chart information on all timeframes and currency pairs AFAIK.
CHAMELEON changes the colors of the bars based on mathematical sequencing in order to identify trends and relationships between price action. This indicator suggests trade setup ideas with an acceptable probability of success especially if another filter is used such as the time resistant principles of Supply and Demand.
=================
COLOR LEGEND:
=================
MAROON candles can be excellent signals for a SHORT entry. They often act as range markers before a tradeable move down as shown, but also usually are the local top from which price recedes from quickly
FOREST GREEN candles indicate that the price is in an up trend.
RED candles indicate that the price is in an up trend.
YELLOW bars are a useful trigger to close SHORTS. They are also the first condition needed in order for a confirmed trend reversal up to be detected.
GREEN TRIANGLE UP shapes below the candle confirm the trend reversal up which was highlighted by the yellow candle.
RED TRIANGLE DOWN shapes above the candle suggests that the trend is not so strong and the stop loss should be moved up to a tighter position.
ORANGE candles help establish a local range.
ORANGE candles with a golden cross provide a clue of the direction, but are not strong enough indicators to take a trade on.
OLIVE bars are a useful trigger to close LONGS, in order to get a better entry at a lower price near to local resistance level .
MAGENTA candles help establish a local range. Unlike the ORANGE ones, these usually occur at the bottom of price structure.
TEAL Candles, indicate a High in a sequence of 5 candles. They predict a downside reversal of 1-3 bars. This is not usually an entry candle, but a possible LONG exit until the trend is clear again.
SEA GREEN candles indicate that the UP trend is weak.
GRAY signifies NO trend.
MAROON TRIANGLE DOWN shapes below the center of candle body indicates there is momentum to the downside. Use this as a filter to discourage LONG entries and also for a SHORT entry since this is a strong signal.
GREEN TRIANGLE UP shapes above the center of candle body indicates there is momentum to the upside. Use this as a filter to discourage SHORT entries.
=================
SETTINGS and ALERTS:
=================
There is a BAR 2 BAR Relationship setting which displays whether there is a simple relationship between the current bar and the previous. Bars with no Bar2Bar triangle have no relationship. So the info here would be no trend relationship, which is useful because it's not mathematically possible for a trend to start without there being a BAR 2 BAR in that direction first. Since the measurement is so short term, you wouldn't use a B2B in isolation.
The indicator has alert conditions set for the possible ENTRY candles, so you can wait for the GREEN candles on the timeframe you prefer and leave the charts until it arrives. The indicator has been tested on some FOREX markets and BTC and ETH and stands up well across all the usual timeframes.
Added an option to enable pivot ranges, (disabled by default because pivots are pesky and it is better to be patient to see how they play out)
Added a rule to close a SHORT if the price touches DEMAND in profit.
Added a rule to close a LONG if the price touches SUPPLY in profit
Stop Limit Optimisation using ATR(14) with thanks to the "Signal-for-Backtesting-Trading-Engine-PineCoders"
Removed some legacy stop limit calculations and variables.
Improved variable resetting.
Also reduced the clutter on the chart when the Trade Entry Ideas is selected. The testing with the Backtesting Engine highlighted the deficiency in this indicator with respect to optimising trade exits (both take profit levels and stop losses need to be carefully considered). Therefore it is fitting that the indicator does not continually paint these ideas. The ideas are a good start and with correct risk management and discipline they can be used to help produce a consistent trading method, but they cannot be relied upon entirely as the trading system panacea to solve all markets in all timeframes at all times!
Hammer and Star candle detection added to assist trade management.
The label now shows this score over the most recent closed candle.
Added an option so that the CHAMELEON SCORE value can be shown over the last closed candle.
Skrip hanya-undangan
Hanya pengguna yang disetujui oleh penulis yang dapat mengakses skrip ini. Anda perlu meminta dan mendapatkan izin untuk menggunakannya. Izin ini biasanya diberikan setelah pembayaran. Untuk detail selengkapnya, ikuti petunjuk penulis di bawah ini atau hubungi ChartChameleon secara langsung.
TradingView TIDAK menyarankan untuk membayar atau menggunakan skrip kecuali Anda sepenuhnya mempercayai pembuatnya dan memahami cara kerjanya. Anda juga dapat menemukan alternatif yang gratis dan sumber terbuka di skrip komunitas kami.
Instruksi penulis
Pernyataan Penyangkalan
Skrip hanya-undangan
Hanya pengguna yang disetujui oleh penulis yang dapat mengakses skrip ini. Anda perlu meminta dan mendapatkan izin untuk menggunakannya. Izin ini biasanya diberikan setelah pembayaran. Untuk detail selengkapnya, ikuti petunjuk penulis di bawah ini atau hubungi ChartChameleon secara langsung.
TradingView TIDAK menyarankan untuk membayar atau menggunakan skrip kecuali Anda sepenuhnya mempercayai pembuatnya dan memahami cara kerjanya. Anda juga dapat menemukan alternatif yang gratis dan sumber terbuka di skrip komunitas kami.