OPEN-SOURCE SCRIPT
Diupdate ZigZag with Fibonacci Levels
Hello Traders,
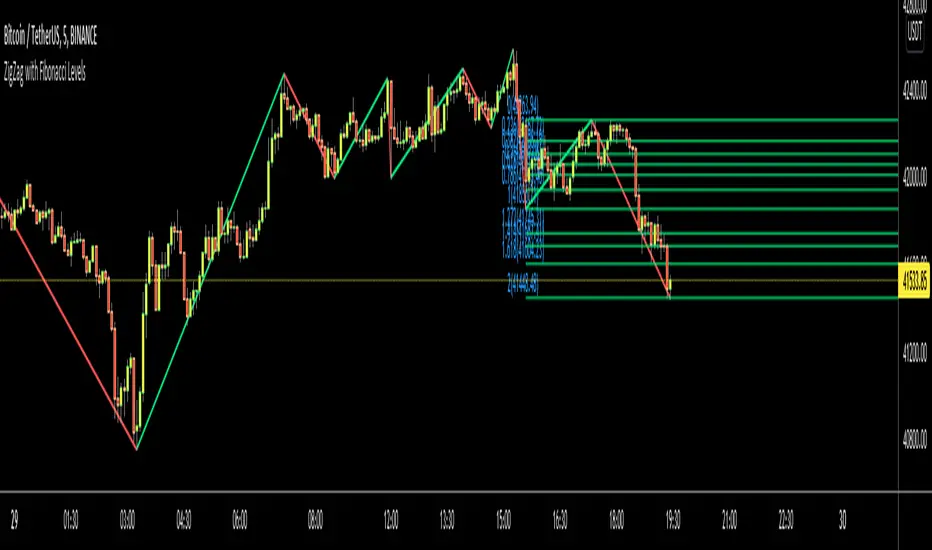
This is "ZigZag with Fibonacci Levels" script. It finds the ZigZag, draw Fibonacci lines and put labels accordingly. I get many requests for this script, so here it is.
You can set ZigZag period as you wish. Bigger numbers (such 20, 30) may give better perspective and result.
It draws Fibonacci levels between 0%-100% and If the price goes higher/lower than 100% level than the script draws Fibonacci Levels accordingly. This means it draws Fibonacci levels until this levels get higher/lower than the price.
As an example:

if you don't want to see ZigZag Lines then you have option to disable it and see only Fibonacci levels:

You have coloring options for Zigzag, Fibonacci lines and texts:

Enjoy!
This is "ZigZag with Fibonacci Levels" script. It finds the ZigZag, draw Fibonacci lines and put labels accordingly. I get many requests for this script, so here it is.
You can set ZigZag period as you wish. Bigger numbers (such 20, 30) may give better perspective and result.
It draws Fibonacci levels between 0%-100% and If the price goes higher/lower than 100% level than the script draws Fibonacci Levels accordingly. This means it draws Fibonacci levels until this levels get higher/lower than the price.
As an example:
if you don't want to see ZigZag Lines then you have option to disable it and see only Fibonacci levels:
You have coloring options for Zigzag, Fibonacci lines and texts:
Enjoy!
Catatan Rilis
Added Price Levels to the labels.Catatan Rilis
- You have now option to enable/disable following Fibonnaci Levels:---> 0.236
---> 0.382
---> 0.500
---> 0.618
---> 0.786
- "Label Location" option added. Fibonacci levels can be shown at Left or Right. when the session is closed then labels at right may not be shown accordingly.
An example: some fibonacci levels disabled, also labeling at right.
Catatan Rilis
Options improvedZigzag part improved
round_to_mintick() function used
bar_index is used for labels (instead of time)
Catatan Rilis
updatedSkrip open-source
Dengan semangat TradingView yang sesungguhnya, pembuat skrip ini telah menjadikannya sebagai sumber terbuka, sehingga para trader dapat meninjau dan memverifikasi fungsinya. Salut untuk penulisnya! Meskipun Anda dapat menggunakannya secara gratis, perlu diingat bahwa penerbitan ulang kode ini tunduk pada Tata Tertib kami.
Our official telegram channel is t.me/+nOh3yWZOYINlOWIy
Pernyataan Penyangkalan
Informasi dan publikasi ini tidak dimaksudkan, dan bukan merupakan, saran atau rekomendasi keuangan, investasi, trading, atau jenis lainnya yang diberikan atau didukung oleh TradingView. Baca selengkapnya di Ketentuan Penggunaan.
Skrip open-source
Dengan semangat TradingView yang sesungguhnya, pembuat skrip ini telah menjadikannya sebagai sumber terbuka, sehingga para trader dapat meninjau dan memverifikasi fungsinya. Salut untuk penulisnya! Meskipun Anda dapat menggunakannya secara gratis, perlu diingat bahwa penerbitan ulang kode ini tunduk pada Tata Tertib kami.
Our official telegram channel is t.me/+nOh3yWZOYINlOWIy
Pernyataan Penyangkalan
Informasi dan publikasi ini tidak dimaksudkan, dan bukan merupakan, saran atau rekomendasi keuangan, investasi, trading, atau jenis lainnya yang diberikan atau didukung oleh TradingView. Baca selengkapnya di Ketentuan Penggunaan.