OPEN-SOURCE SCRIPT
Velocity And Acceleration with Strategy: Traders Magazine
◙ OVERVIEW
Hi, Ivestors and Traders... This Indicator, the focus is Scott Cong's article in the Stocks & Commodities September issue, “VAcc: A Momentum Indicator Based On Velocity And Acceleration”. I have also added a trading strategy for you to benefit from this indicator. First of all, let's look at what the indicator offers us and what its logic is. First, let's focus on the logic of the strategy.
◙ CONCEPTS
Here is a new indicator based on some simple physics concepts that is easy to use, responsive and precise. Learn how to calculate and use it.
The field of physics gives us some important principles that are highly applicable to analyzing the markets. In this indicator, I will present a momentum indicator. Scott Cong developed based on the concepts of velocity and acceleration this indicator. Of the many characteristics of price that traders and analysts often study, rate and rate of change are useful ones. In other words, it’s helpful to know: How fast is price moving, and is it speeding up or slowing down? How is price changing from one period to the next? The indicator I’m introducing here is calculated using the current bar (C) and every bar of a lookback period from the current bar. He named the indicator the VAcc since it’s based on the average of velocity line (av) and acceleration line (Acc) over the lookback period. For longer periods, the VAcc behaves the same way as the MACD, only it’s simpler, more responsive, and more precise. Interestingly, for shorter periods, VAcc exhibits characteristics of an oscillator, such as the stochastics oscillator.
◙ CALCULATION
The calculation of VAcc involves the following steps:
1. Relatively weighted average where the nearer price has the largest influence.
Pine Script®
2. The Velocity Average is smoothed with an exponential moving average. Now it get:
Pine Script®
3. Similarly, accelerations for each bar within the lookback period and scale factor are calculated as:
Pine Script®
◙ STRATEGY
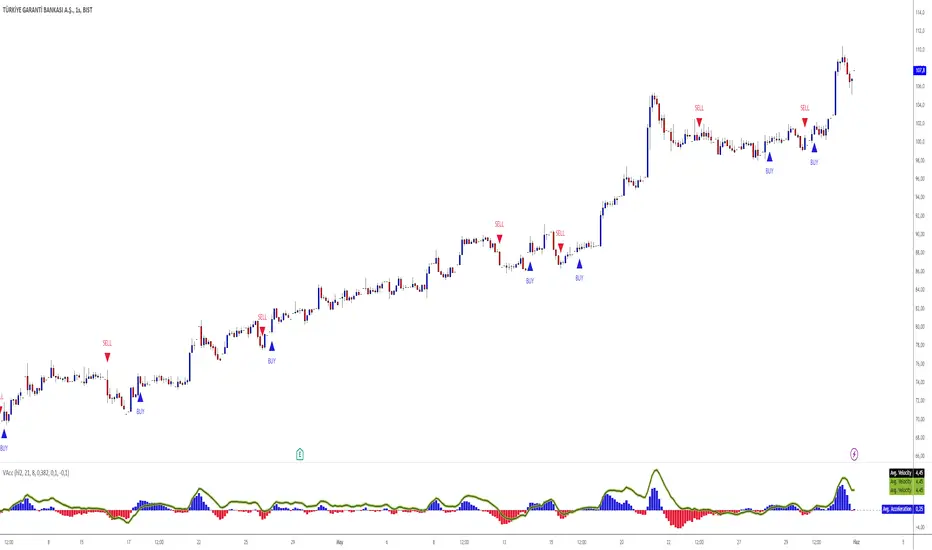
In fact, Scott probably preferred to use it in periods 9 and 26 because it was similar to Macd and used the ratio of 0.5. However, I preferred to use the 8 and 21 periods to provide signals closer to the stochastic oscillator in the short term and used the 0.382 ratio. The logic of the strategy is this
Long Strategy → acc(Acceleration Line) > 0.1 and av(Velocity Average Line) > 0.1(Long Factor)
Short strategy → acc(Acceleration Line) < -0.1 and av(Velocity Average Line) < -0.1(Long Factor)
Here, you can change the Short Factor and Long Factor as you wish and produce more meaningful results that are closer to your own strategy.
I hope you benefits...

◙ GENEL BAKIŞ
Merhaba Yatırımcılar ve Yatırımcılar... Bu Gösterge, Scott Cong'un Stocks & Emtia Eylül sayısındaki “VAcc: Hız ve İvmeye Dayalı Bir Momentum Göstergesi” başlıklı makalesine odaklanmaktadır. Bu göstergeden faydalanabilmeniz için bir ticaret stratejisi de ekledim. Öncelikle göstergenin bize neler sunduğuna ve mantığının ne olduğuna bakalım. Öncelikle stratejinin mantığına odaklanalım.
◙ KAVRAMLAR
İşte kullanımı kolay, duyarlı ve kesin bazı basit fizik kavramlarına dayanan yeni bir gösterge. Nasıl hesaplanacağını ve kullanılacağını öğrenin.
Fizik alanı bize piyasaları analiz etmede son derece uygulanabilir bazı önemli ilkeler verir. Bu göstergede bir momentum göstergesi sunacağım. Scott Cong bu göstergeyi hız ve ivme kavramlarına dayanarak geliştirdi. Yatırımcıların ve analistlerin sıklıkla incelediği fiyatın pek çok özelliği arasında değişim oranı ve oranı yararlı olanlardır. Başka bir deyişle şunu bilmek faydalı olacaktır: Fiyat ne kadar hızlı hareket ediyor ve hızlanıyor mu, yavaşlıyor mu? Fiyatlar bir dönemden diğerine nasıl değişiyor? Burada tanıtacağım gösterge, mevcut çubuk (C) ve mevcut çubuktan bir yeniden inceleme döneminin her çubuğu kullanılarak hesaplanır. Göstergeye, yeniden inceleme dönemi boyunca hız çizgisinin (av) ve ivme çizgisinin (Acc) ortalamasına dayandığı için VAcc adını verdi. Daha uzun süreler boyunca VACc, MACD ile aynı şekilde davranır, yalnızca daha basit, daha duyarlı ve daha hassastır. İlginç bir şekilde, daha kısa süreler için VAcc, stokastik osilatör gibi bir osilatörün özelliklerini sergiliyor.
◙ HESAPLAMA
VAcc'nin hesaplanması aşağıdaki adımları içerir:
1. Yakın zamandaki fiyatın en büyük etkiye sahip olduğu göreceli ağırlıklı ortalamayı hesaplatıyoruz.
Pine Script®
2. Hız Ortalamasına üstel hareketli ortalamayla düzleştirme uygulanır. Şimdi bu şekilde aşağıdaki kod ile bunu şöyle elde ediyoruz:
Pine Script®
3. Benzer şekilde, yeniden inceleme süresi ve ölçek faktörü içindeki her bir çubuk için fiyattaki ivmelenler yada momentum şu şekilde hesaplanır:
Pine Script®
◙ STRATEJİ
Aslında Scott muhtemelen Macd'e benzediği ve 0,5 oranını kullandığı için 9. ve 26. periyotlarda kullanmayı tercih etmişti. Ancak kısa vadede stokastik osilatöre daha yakın sinyaller sağlamak için 8 ve 21 periyotlarını kullanmayı tercih ettim ve 0,382 oranını kullandım. Stratejinin mantığı şu
Uzun Strateji → acc(İvme Çizgisi) > 0,1 ve av(Hız Ortalama Çizgisi) > 0,1(Uzun Faktör)
Kısa strateji → acc(İvme Çizgisi) < -0,1 ve av(Hız Ortalama Çizgisi) < -0,1(Uzun Faktör)
Burada Kısa Faktör ve Uzun Faktör' ü dilediğiniz gibi değiştirip, kendi stratejinize daha yakın, daha anlamlı sonuçlar üretebilirsiniz.
umarım faydasını görürsün...
Hi, Ivestors and Traders... This Indicator, the focus is Scott Cong's article in the Stocks & Commodities September issue, “VAcc: A Momentum Indicator Based On Velocity And Acceleration”. I have also added a trading strategy for you to benefit from this indicator. First of all, let's look at what the indicator offers us and what its logic is. First, let's focus on the logic of the strategy.
◙ CONCEPTS
Here is a new indicator based on some simple physics concepts that is easy to use, responsive and precise. Learn how to calculate and use it.
The field of physics gives us some important principles that are highly applicable to analyzing the markets. In this indicator, I will present a momentum indicator. Scott Cong developed based on the concepts of velocity and acceleration this indicator. Of the many characteristics of price that traders and analysts often study, rate and rate of change are useful ones. In other words, it’s helpful to know: How fast is price moving, and is it speeding up or slowing down? How is price changing from one period to the next? The indicator I’m introducing here is calculated using the current bar (C) and every bar of a lookback period from the current bar. He named the indicator the VAcc since it’s based on the average of velocity line (av) and acceleration line (Acc) over the lookback period. For longer periods, the VAcc behaves the same way as the MACD, only it’s simpler, more responsive, and more precise. Interestingly, for shorter periods, VAcc exhibits characteristics of an oscillator, such as the stochastics oscillator.
◙ CALCULATION
The calculation of VAcc involves the following steps:
1. Relatively weighted average where the nearer price has the largest influence.
weighted_avg (float src, int length) =>
float sum = 0.0
for _i = 1 to length
float diff = (src - src[_i]) / _i
sum += diff
sum /= length
2. The Velocity Average is smoothed with an exponential moving average. Now it get:
VAcc (float src, int period, int smoothing) =>
float vel = ta.ema(weighted_avg(src, period), smoothing)
float acc = weighted_avg(vel, period)
[100.0 * vel, 100.0 * acc]
3. Similarly, accelerations for each bar within the lookback period and scale factor are calculated as:
[av, acc] = VAcc(src, length1, length2)
av /= (length1 * scale_factor)
◙ STRATEGY
In fact, Scott probably preferred to use it in periods 9 and 26 because it was similar to Macd and used the ratio of 0.5. However, I preferred to use the 8 and 21 periods to provide signals closer to the stochastic oscillator in the short term and used the 0.382 ratio. The logic of the strategy is this
Long Strategy → acc(Acceleration Line) > 0.1 and av(Velocity Average Line) > 0.1(Long Factor)
Short strategy → acc(Acceleration Line) < -0.1 and av(Velocity Average Line) < -0.1(Long Factor)
Here, you can change the Short Factor and Long Factor as you wish and produce more meaningful results that are closer to your own strategy.
I hope you benefits...
◙ GENEL BAKIŞ
Merhaba Yatırımcılar ve Yatırımcılar... Bu Gösterge, Scott Cong'un Stocks & Emtia Eylül sayısındaki “VAcc: Hız ve İvmeye Dayalı Bir Momentum Göstergesi” başlıklı makalesine odaklanmaktadır. Bu göstergeden faydalanabilmeniz için bir ticaret stratejisi de ekledim. Öncelikle göstergenin bize neler sunduğuna ve mantığının ne olduğuna bakalım. Öncelikle stratejinin mantığına odaklanalım.
◙ KAVRAMLAR
İşte kullanımı kolay, duyarlı ve kesin bazı basit fizik kavramlarına dayanan yeni bir gösterge. Nasıl hesaplanacağını ve kullanılacağını öğrenin.
Fizik alanı bize piyasaları analiz etmede son derece uygulanabilir bazı önemli ilkeler verir. Bu göstergede bir momentum göstergesi sunacağım. Scott Cong bu göstergeyi hız ve ivme kavramlarına dayanarak geliştirdi. Yatırımcıların ve analistlerin sıklıkla incelediği fiyatın pek çok özelliği arasında değişim oranı ve oranı yararlı olanlardır. Başka bir deyişle şunu bilmek faydalı olacaktır: Fiyat ne kadar hızlı hareket ediyor ve hızlanıyor mu, yavaşlıyor mu? Fiyatlar bir dönemden diğerine nasıl değişiyor? Burada tanıtacağım gösterge, mevcut çubuk (C) ve mevcut çubuktan bir yeniden inceleme döneminin her çubuğu kullanılarak hesaplanır. Göstergeye, yeniden inceleme dönemi boyunca hız çizgisinin (av) ve ivme çizgisinin (Acc) ortalamasına dayandığı için VAcc adını verdi. Daha uzun süreler boyunca VACc, MACD ile aynı şekilde davranır, yalnızca daha basit, daha duyarlı ve daha hassastır. İlginç bir şekilde, daha kısa süreler için VAcc, stokastik osilatör gibi bir osilatörün özelliklerini sergiliyor.
◙ HESAPLAMA
VAcc'nin hesaplanması aşağıdaki adımları içerir:
1. Yakın zamandaki fiyatın en büyük etkiye sahip olduğu göreceli ağırlıklı ortalamayı hesaplatıyoruz.
weighted_avg (float src, int length) =>
float sum = 0.0
for _i = 1 to length
float diff = (src - src[_i]) / _i
sum += diff
sum /= length
2. Hız Ortalamasına üstel hareketli ortalamayla düzleştirme uygulanır. Şimdi bu şekilde aşağıdaki kod ile bunu şöyle elde ediyoruz:
VAcc (float src, int period, int smoothing) =>
float vel = ta.ema(weighted_avg(src, period), smoothing)
float acc = weighted_avg(vel, period)
[100.0 * vel, 100.0 * acc]
3. Benzer şekilde, yeniden inceleme süresi ve ölçek faktörü içindeki her bir çubuk için fiyattaki ivmelenler yada momentum şu şekilde hesaplanır:
[av, acc] = VAcc(src, length1, length2)
av /= (length1 * scale_factor)
◙ STRATEJİ
Aslında Scott muhtemelen Macd'e benzediği ve 0,5 oranını kullandığı için 9. ve 26. periyotlarda kullanmayı tercih etmişti. Ancak kısa vadede stokastik osilatöre daha yakın sinyaller sağlamak için 8 ve 21 periyotlarını kullanmayı tercih ettim ve 0,382 oranını kullandım. Stratejinin mantığı şu
Uzun Strateji → acc(İvme Çizgisi) > 0,1 ve av(Hız Ortalama Çizgisi) > 0,1(Uzun Faktör)
Kısa strateji → acc(İvme Çizgisi) < -0,1 ve av(Hız Ortalama Çizgisi) < -0,1(Uzun Faktör)
Burada Kısa Faktör ve Uzun Faktör' ü dilediğiniz gibi değiştirip, kendi stratejinize daha yakın, daha anlamlı sonuçlar üretebilirsiniz.
umarım faydasını görürsün...
Skrip open-source
Dengan semangat TradingView yang sesungguhnya, pembuat skrip ini telah menjadikannya sebagai sumber terbuka, sehingga para trader dapat meninjau dan memverifikasi fungsinya. Salut untuk penulisnya! Meskipun Anda dapat menggunakannya secara gratis, perlu diingat bahwa penerbitan ulang kode ini tunduk pada Tata Tertib kami.
Buy & Look My Premium Algo & Indicator: whop.com/nfinanspremium
Join Our Discord Community: discord.com/invite/c9bwqrKxm3
Indicators Tuttorial:
youtube.com/watch?v=rSwz1ISU9r0&list=PL6r4M5EOm1fMCJZxE7RDafk-DnrxLJY5y
Join Our Discord Community: discord.com/invite/c9bwqrKxm3
Indicators Tuttorial:
youtube.com/watch?v=rSwz1ISU9r0&list=PL6r4M5EOm1fMCJZxE7RDafk-DnrxLJY5y
Pernyataan Penyangkalan
Informasi dan publikasi ini tidak dimaksudkan, dan bukan merupakan, saran atau rekomendasi keuangan, investasi, trading, atau jenis lainnya yang diberikan atau didukung oleh TradingView. Baca selengkapnya di Ketentuan Penggunaan.