OPEN-SOURCE SCRIPT
Diupdate Volume Balance Indicator Stealthy7
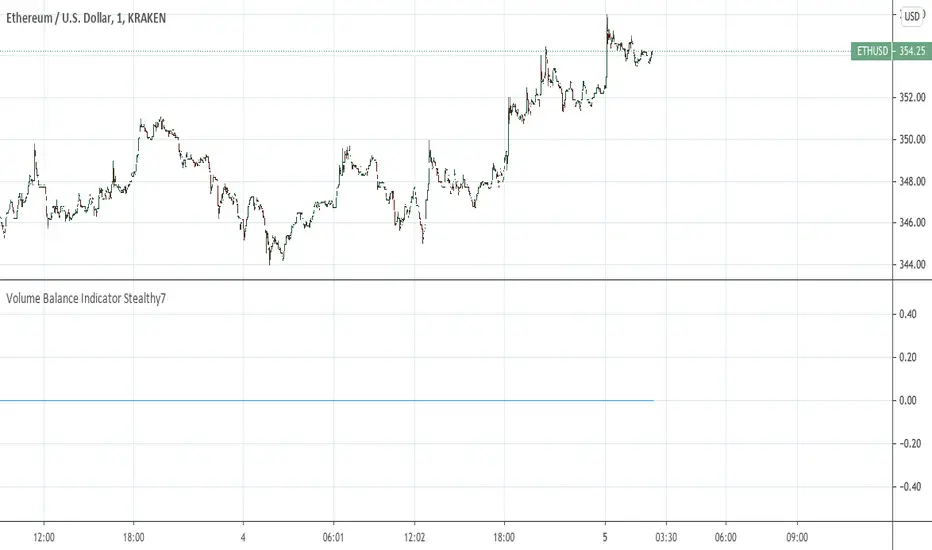
Find out if Bulls (buys) or Bears (sells) are moving the price. This gives a clear view of activity, even if you are using a higher time period. The lookback is in minutes, I believe. This is a superior volume indicator. Bars are recolored to show the underlying activity per the look back (minutes).
Catatan Rilis
In this version I fixed the average volume (grey background). If volume eclipses the grey area, its above average by 30 periods.Catatan Rilis
Automatic lookback.Bar re-color option.
Wow! Really shows whats going on.
Catatan Rilis
I got rid of the old way displayed. This is much more useful and looks totally different.I added Standard deviation bands. Now you know if the volume is really on.
I used a hard coded lookback of 30 because its supposed to be significant (?)
Now you can really see a summary of the underlying minute to minute activity on higher bands.
Catatan Rilis
I added a resolution dropdown box and a lookback period. I think this is closer to my original idea. You can view longer periods on a small timeframe. I think you can do vice versa like I originally intended. Not sure, but this is likely final update for this one. I realize now this is like an On Balance Volume indicator with some extras. I think this version is more useful.Catatan Rilis
Changed some unnecessary code and default settings.Catatan Rilis
Script depreciated. No support.Skrip open-source
Dengan semangat TradingView yang sesungguhnya, pembuat skrip ini telah menjadikannya sebagai sumber terbuka, sehingga para trader dapat meninjau dan memverifikasi fungsinya. Salut untuk penulisnya! Meskipun Anda dapat menggunakannya secara gratis, perlu diingat bahwa penerbitan ulang kode ini tunduk pada Tata Tertib kami.
Pernyataan Penyangkalan
Informasi dan publikasi ini tidak dimaksudkan, dan bukan merupakan, saran atau rekomendasi keuangan, investasi, trading, atau jenis lainnya yang diberikan atau didukung oleh TradingView. Baca selengkapnya di Ketentuan Penggunaan.
Skrip open-source
Dengan semangat TradingView yang sesungguhnya, pembuat skrip ini telah menjadikannya sebagai sumber terbuka, sehingga para trader dapat meninjau dan memverifikasi fungsinya. Salut untuk penulisnya! Meskipun Anda dapat menggunakannya secara gratis, perlu diingat bahwa penerbitan ulang kode ini tunduk pada Tata Tertib kami.
Pernyataan Penyangkalan
Informasi dan publikasi ini tidak dimaksudkan, dan bukan merupakan, saran atau rekomendasi keuangan, investasi, trading, atau jenis lainnya yang diberikan atau didukung oleh TradingView. Baca selengkapnya di Ketentuan Penggunaan.