OPEN-SOURCE SCRIPT
D-LEVELS **FUTURECODE**
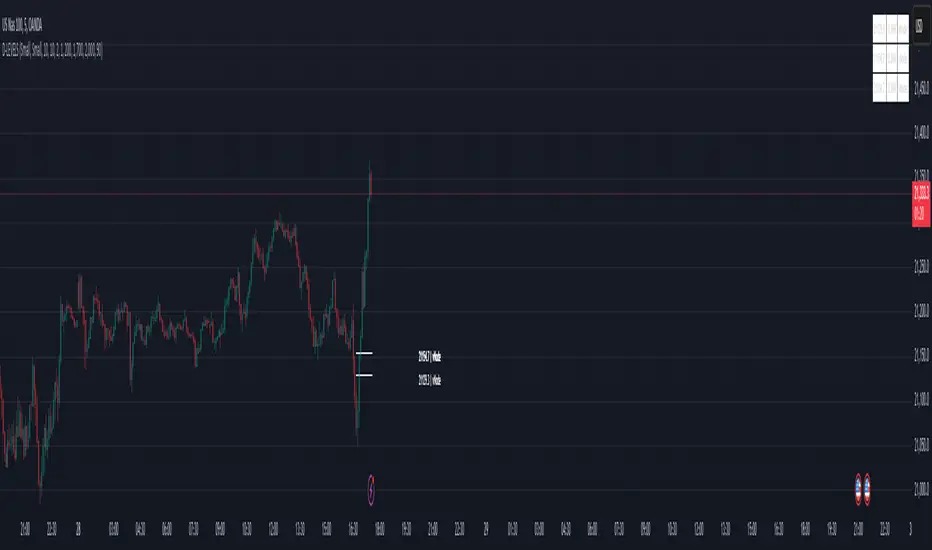
The D-LEVELS indicator helps traders identify key price levels based on high-volume nodes and their relative positions to the current price. It visually displays these dynamic levels on the chart, offering insights into potential support, resistance, or zones of interest for trading decisions.
Key Features for Traders:
Dynamic Volume Nodes: Highlights high-volume price levels across different lookback periods, which can act as support or resistance.
Custom Alerts: Warns traders when price is within a specified percentage range of these levels.
Visual Cues: Uses labels and lines with customizable colors and widths for better chart clarity.
Table Display: Summarizes volume node price levels and their relative percentages for quick reference.
Customization: Flexible input options for text size, colors, and display settings to adapt to individual trading styles.
Use Case:
Traders can incorporate this indicator into their strategy to identify high-probability zones for entries, exits, or trade management by observing the interaction of price with these volume-based levels.
Skrip open-source
Dengan semangat TradingView yang sesungguhnya, pembuat skrip ini telah menjadikannya sebagai sumber terbuka, sehingga para trader dapat meninjau dan memverifikasi fungsinya. Salut untuk penulisnya! Meskipun Anda dapat menggunakannya secara gratis, perlu diingat bahwa penerbitan ulang kode ini tunduk pada Tata Tertib kami.
Pernyataan Penyangkalan
Informasi dan publikasi ini tidak dimaksudkan, dan bukan merupakan, saran atau rekomendasi keuangan, investasi, trading, atau jenis lainnya yang diberikan atau didukung oleh TradingView. Baca selengkapnya di Ketentuan Penggunaan.