OPEN-SOURCE SCRIPT
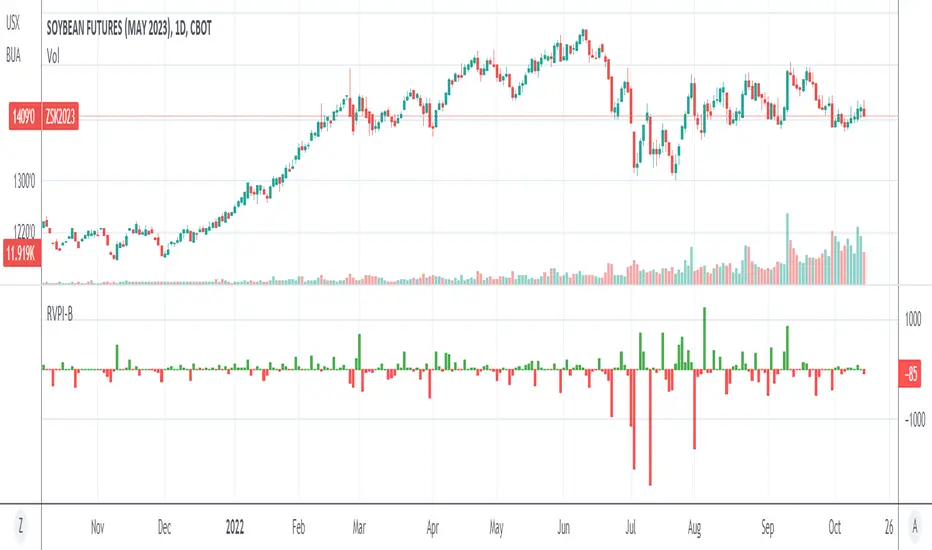
Diupdate Relative Volume Prices Index by @WilliamBelini

What is the impact for Volume to the Prices?
To respond this question, I formulate the hipótesis if a little Volume change a lot the Price, it's a reversion signal, and if a lot of Volume change a little the price, it´s because the price is established.
This is one of 3 indicators created to improve this hipótesis, named:
1. Relative Volume Prices Index by @WilliamBelini (RVPI)
2. Relative Market Status by @WilliamBelini (RMS)
3. Trade Trigger RVPI by @WilliamBelini (TTR)
- The first show you the effect from volume to the prices, meas the sensibility of the variation;
- The second show you the feeling of the market by cicles, based at the cumulative average sensibility from the RVPI indicator;
- The third show you a trigger to trading positions, with the analysis of the historical RVPI data, based on the normal distribution of the futures price variation, by previos RVPI values and some rules created based on data behaviors identified.
To the end of this work, I can comprove the hipótesis, with simulations trading based from the TTR.
How we can´t monetize our work here, on TradingView platform, I´m disponibilize 2 of 3 indicators for you here free. If you want to have the third, discover how to contact with me (@ ;), and for me will be a pleasure to help you.
Catatan Rilis
Update the demonstration chart.Catatan Rilis
Include Volume Indicator to the visualization chart.Catatan Rilis
Deleted unnecessary inputs.Skrip open-source
Dengan semangat TradingView yang sesungguhnya, pembuat skrip ini telah menjadikannya sebagai sumber terbuka, sehingga para trader dapat meninjau dan memverifikasi fungsinya. Salut untuk penulisnya! Meskipun Anda dapat menggunakannya secara gratis, perlu diingat bahwa penerbitan ulang kode ini tunduk pada Tata Tertib kami.
Pernyataan Penyangkalan
Informasi dan publikasi ini tidak dimaksudkan, dan bukan merupakan, saran atau rekomendasi keuangan, investasi, trading, atau jenis lainnya yang diberikan atau didukung oleh TradingView. Baca selengkapnya di Ketentuan Penggunaan.
Skrip open-source
Dengan semangat TradingView yang sesungguhnya, pembuat skrip ini telah menjadikannya sebagai sumber terbuka, sehingga para trader dapat meninjau dan memverifikasi fungsinya. Salut untuk penulisnya! Meskipun Anda dapat menggunakannya secara gratis, perlu diingat bahwa penerbitan ulang kode ini tunduk pada Tata Tertib kami.
Pernyataan Penyangkalan
Informasi dan publikasi ini tidak dimaksudkan, dan bukan merupakan, saran atau rekomendasi keuangan, investasi, trading, atau jenis lainnya yang diberikan atau didukung oleh TradingView. Baca selengkapnya di Ketentuan Penggunaan.